This page is an example of the metrics provided for our top 20 cryptos. Data is comprised of trader sentiment and volume data to give you insight into what could happen next for each particular asset. Charts update Monday through Friday (excluding major U.S. Holidays) by 8am PT accompanied by a last updated date stamp. o your phone, computer or email when a signal appears. It's awesome!!
Bitcoin Emotional Index
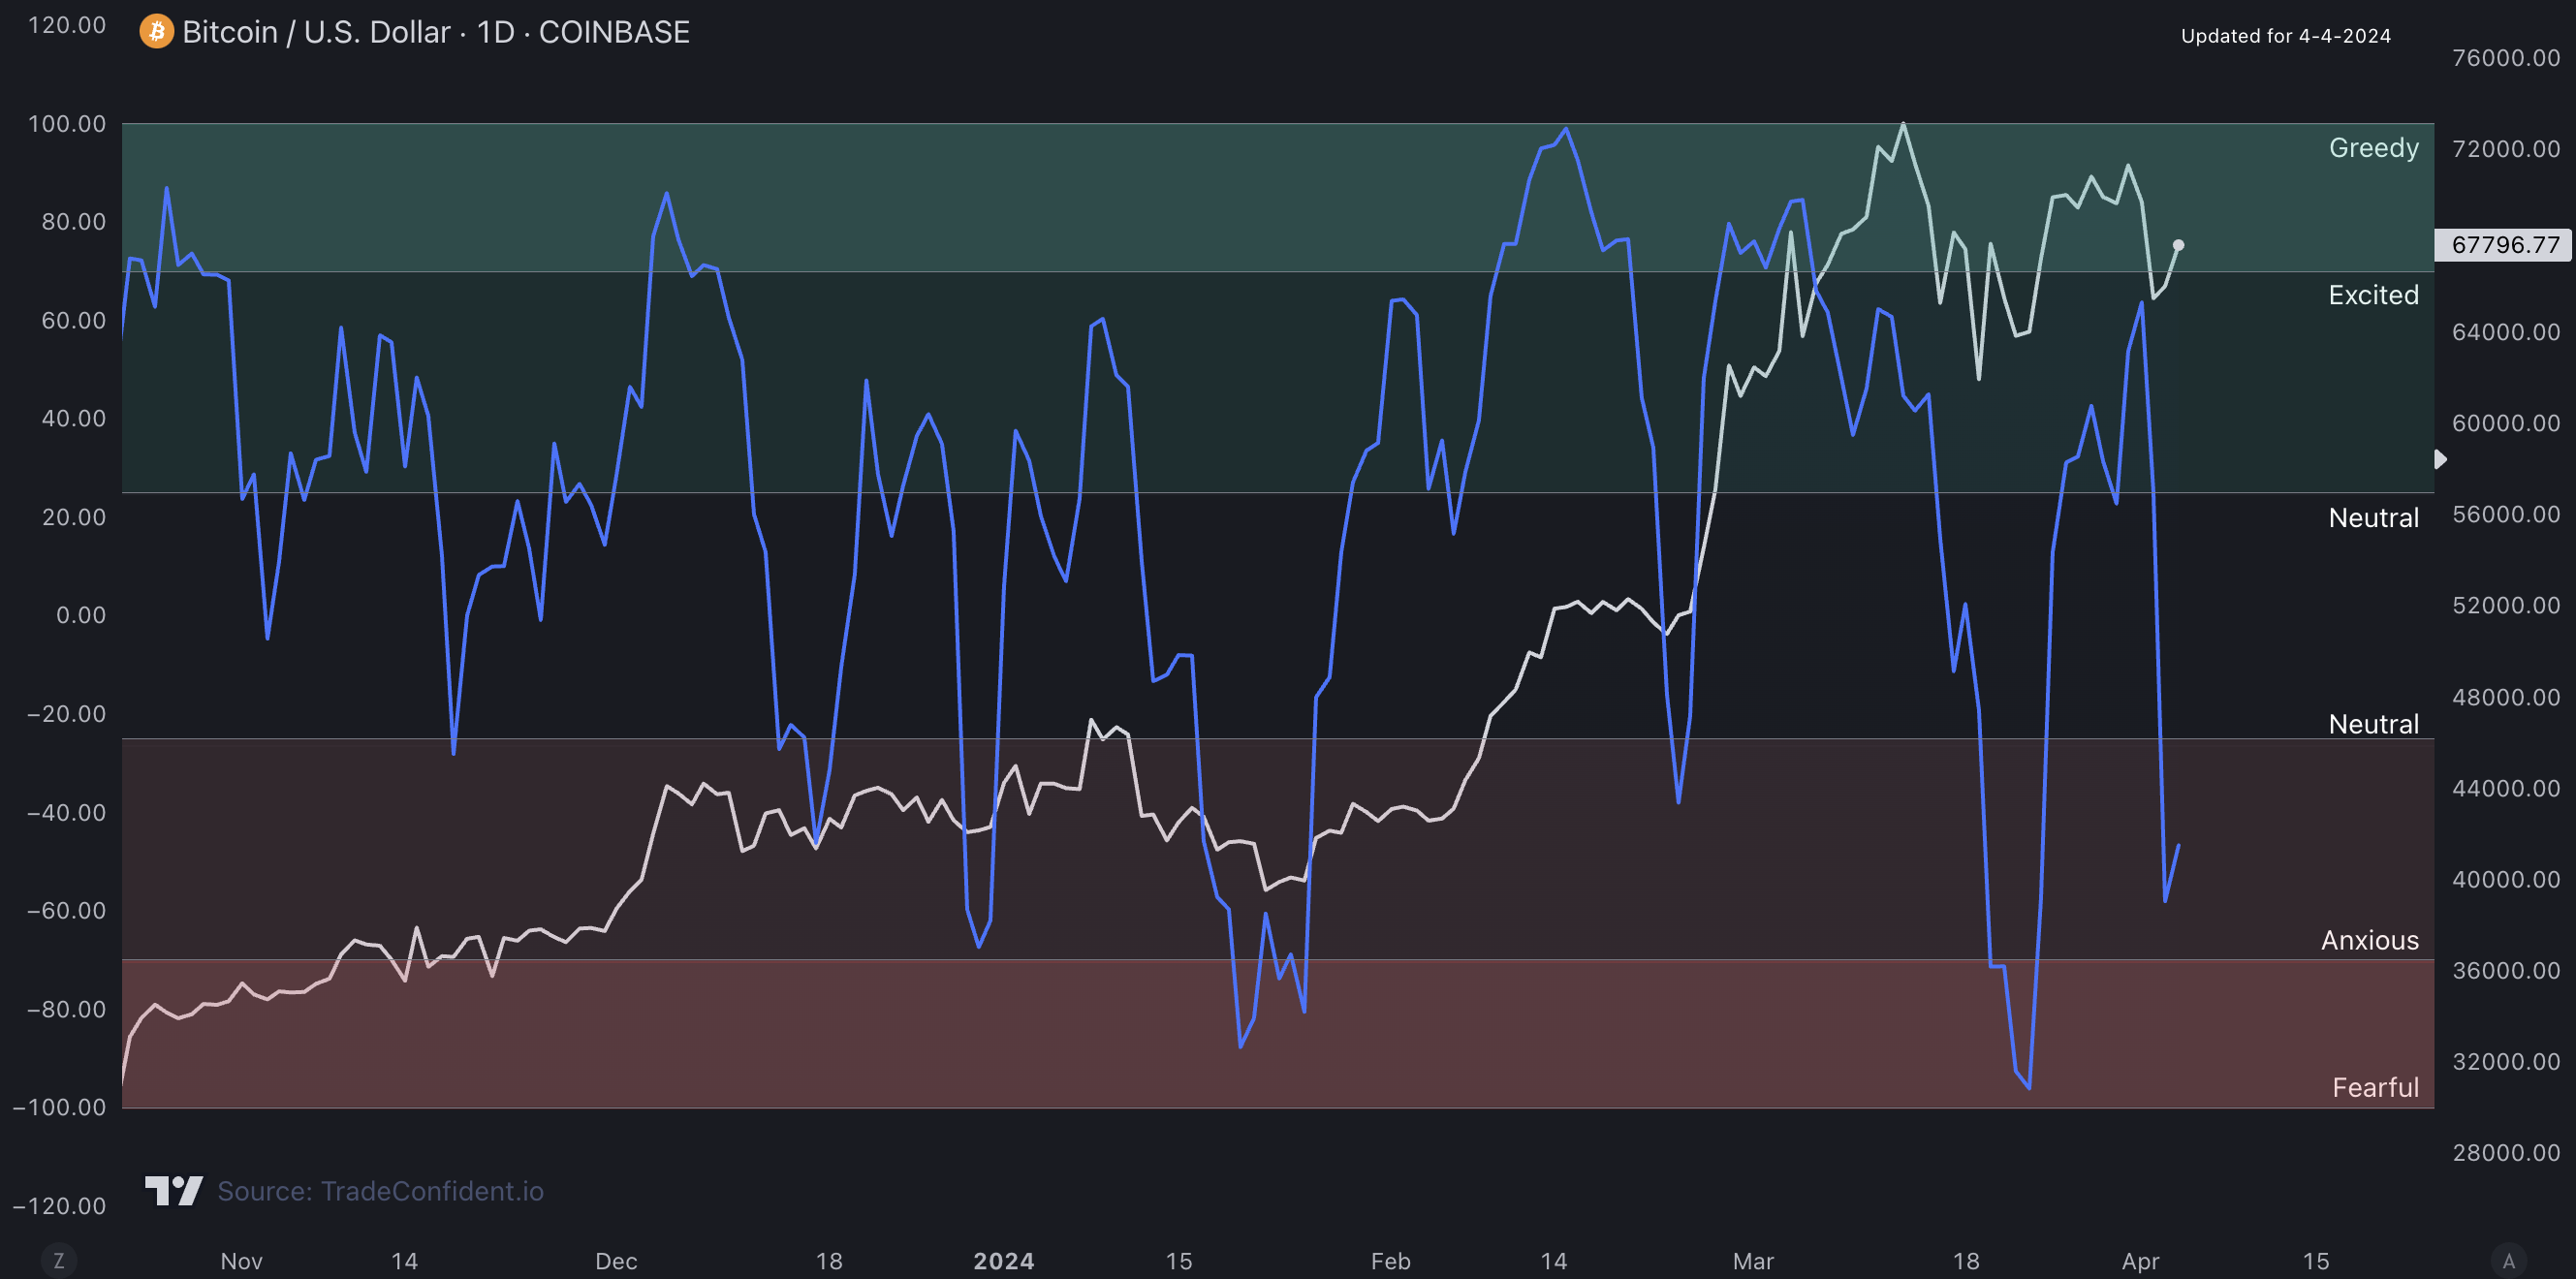
White: Price | Blue: Emotional Sentiment
If the blue line is in the anxious or fearful section, this is historically where long trades do best. If the blue line is in the excited or greedy section, this is historically where short trades do best.
How we trade with this metric: Tutorial Video
Bitcoin Volatility Breakout Detector
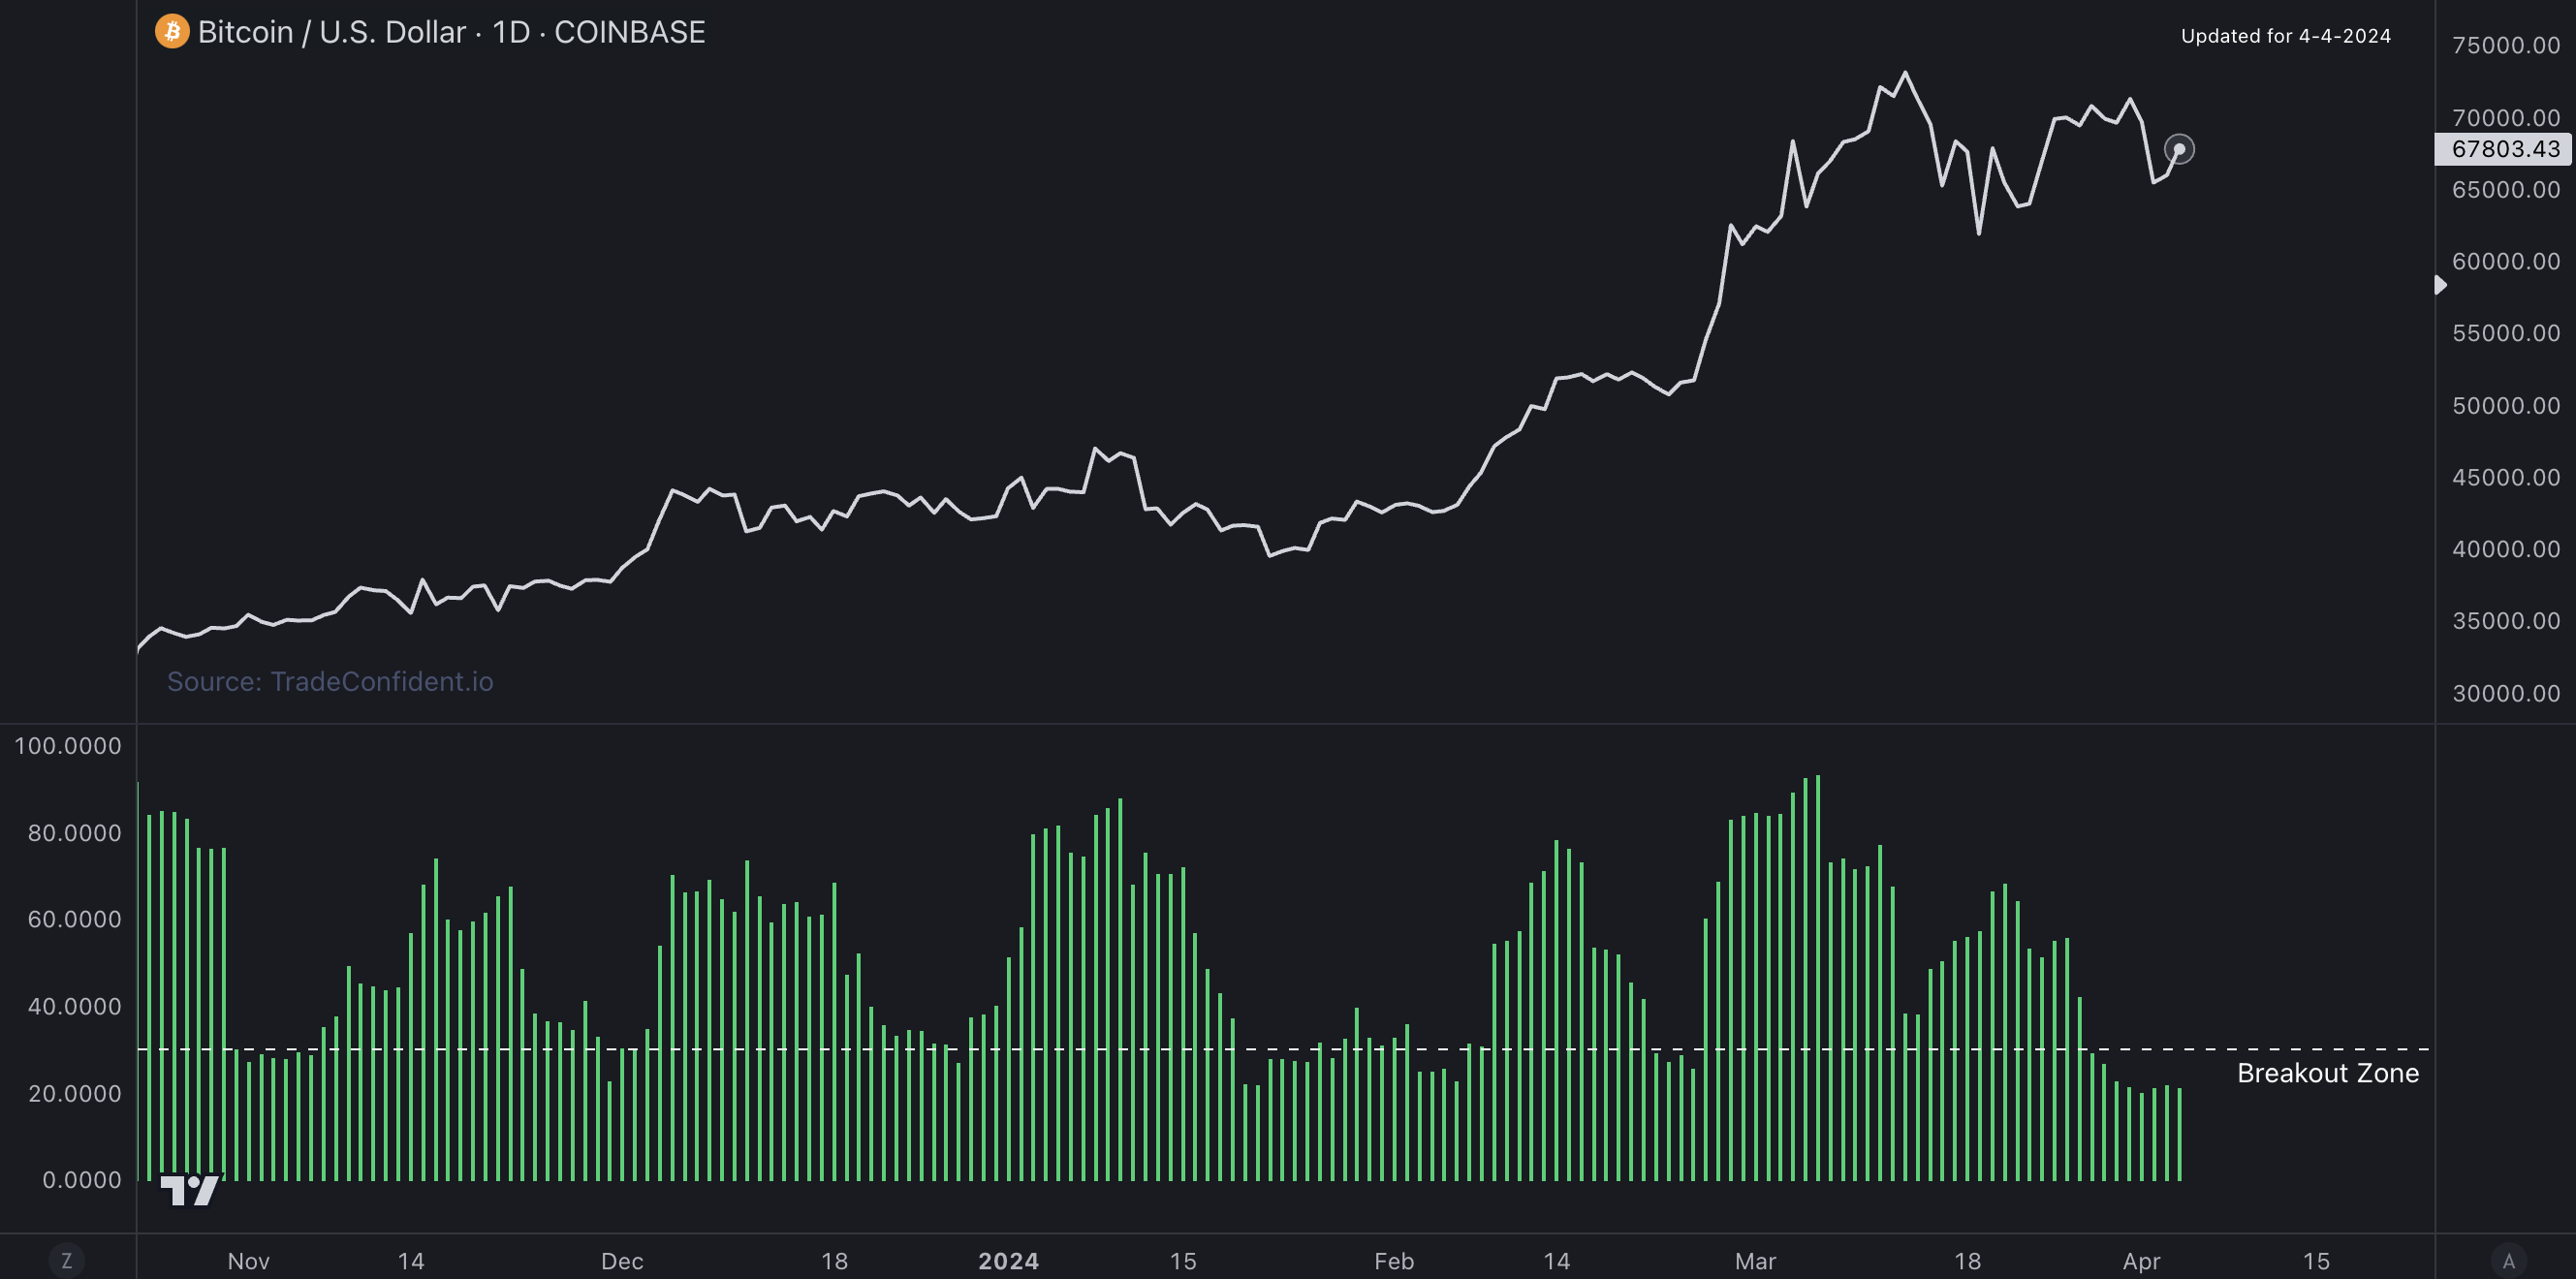
White: Price | Green: Volatility Meter
When green bars form below the bottom white dotted line, this is where low volatility is present in the market, and frequently signals the start of large price breakouts. Watch for the price to move very fast upwards or downwards once we enter this zone.
How we trade with this metric: Tutorial Video
Bitcoin Whale Smart Money
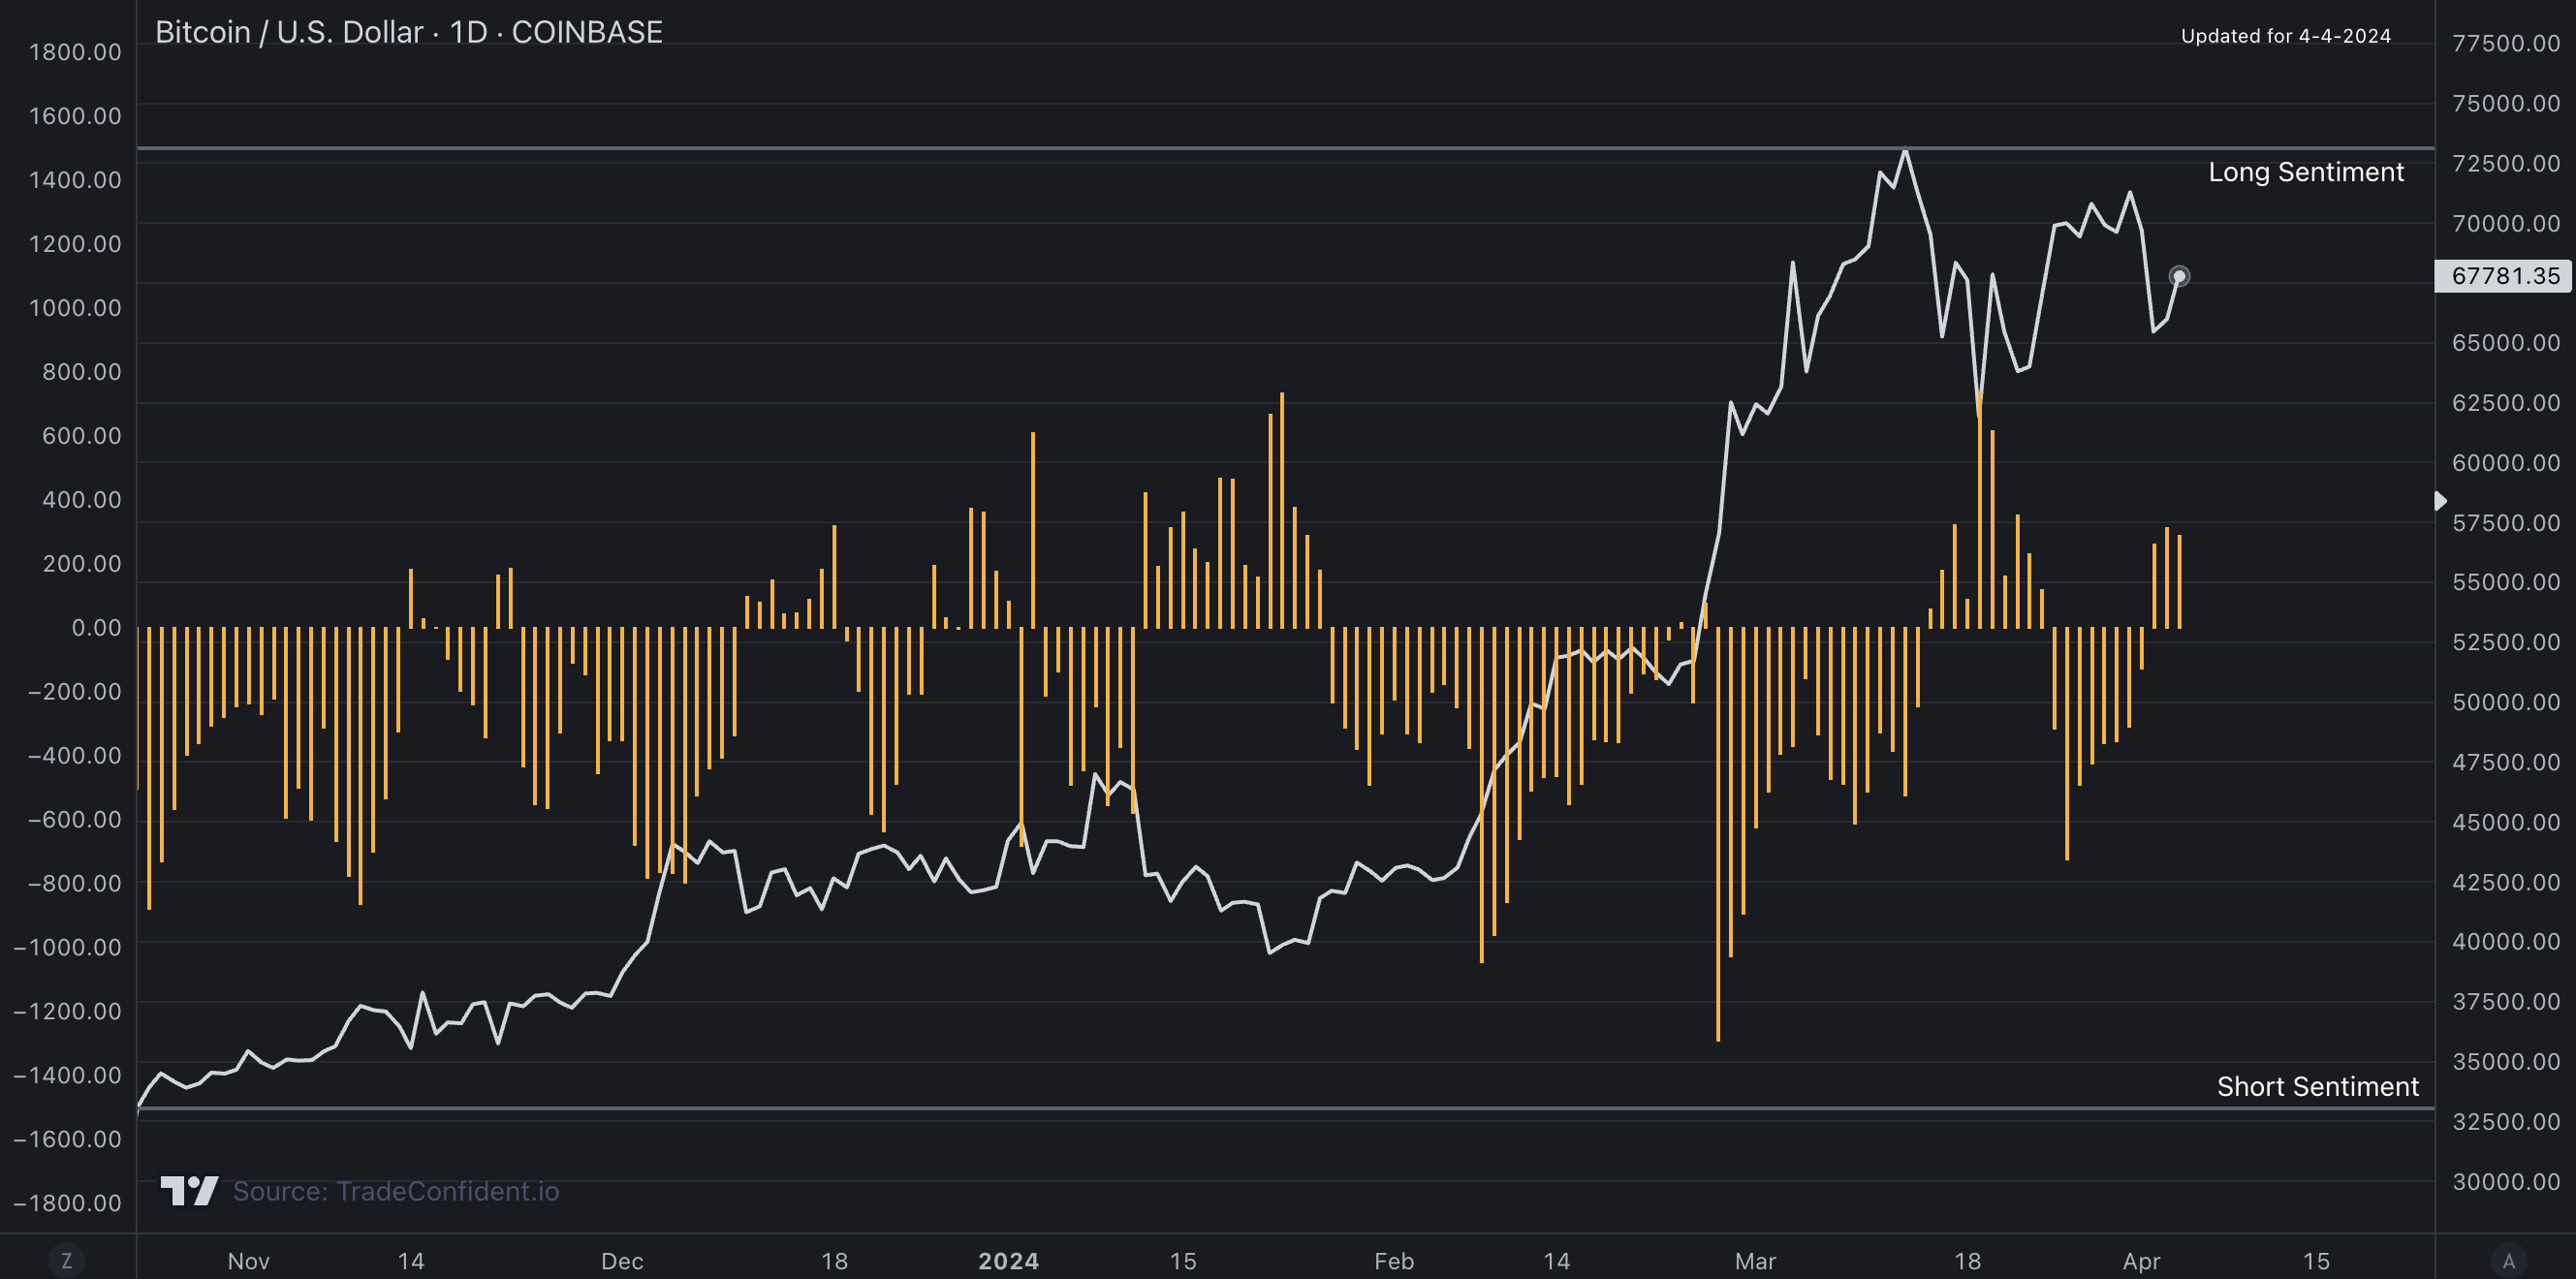
White: Price | Orange: Long vs. Short Trade Sentiment
Smart money's goal is to buy the dips and sell the pumps. Orange bars in the top long sentiment section represent the increased possibility of whales buying the dip. Orange bars in the bottom short sentiment section represent the increased possibility of whales shorting the move up.
How we trade with this metric: Tutorial Video
Bitcoin Whale Money Flow Relative to Price
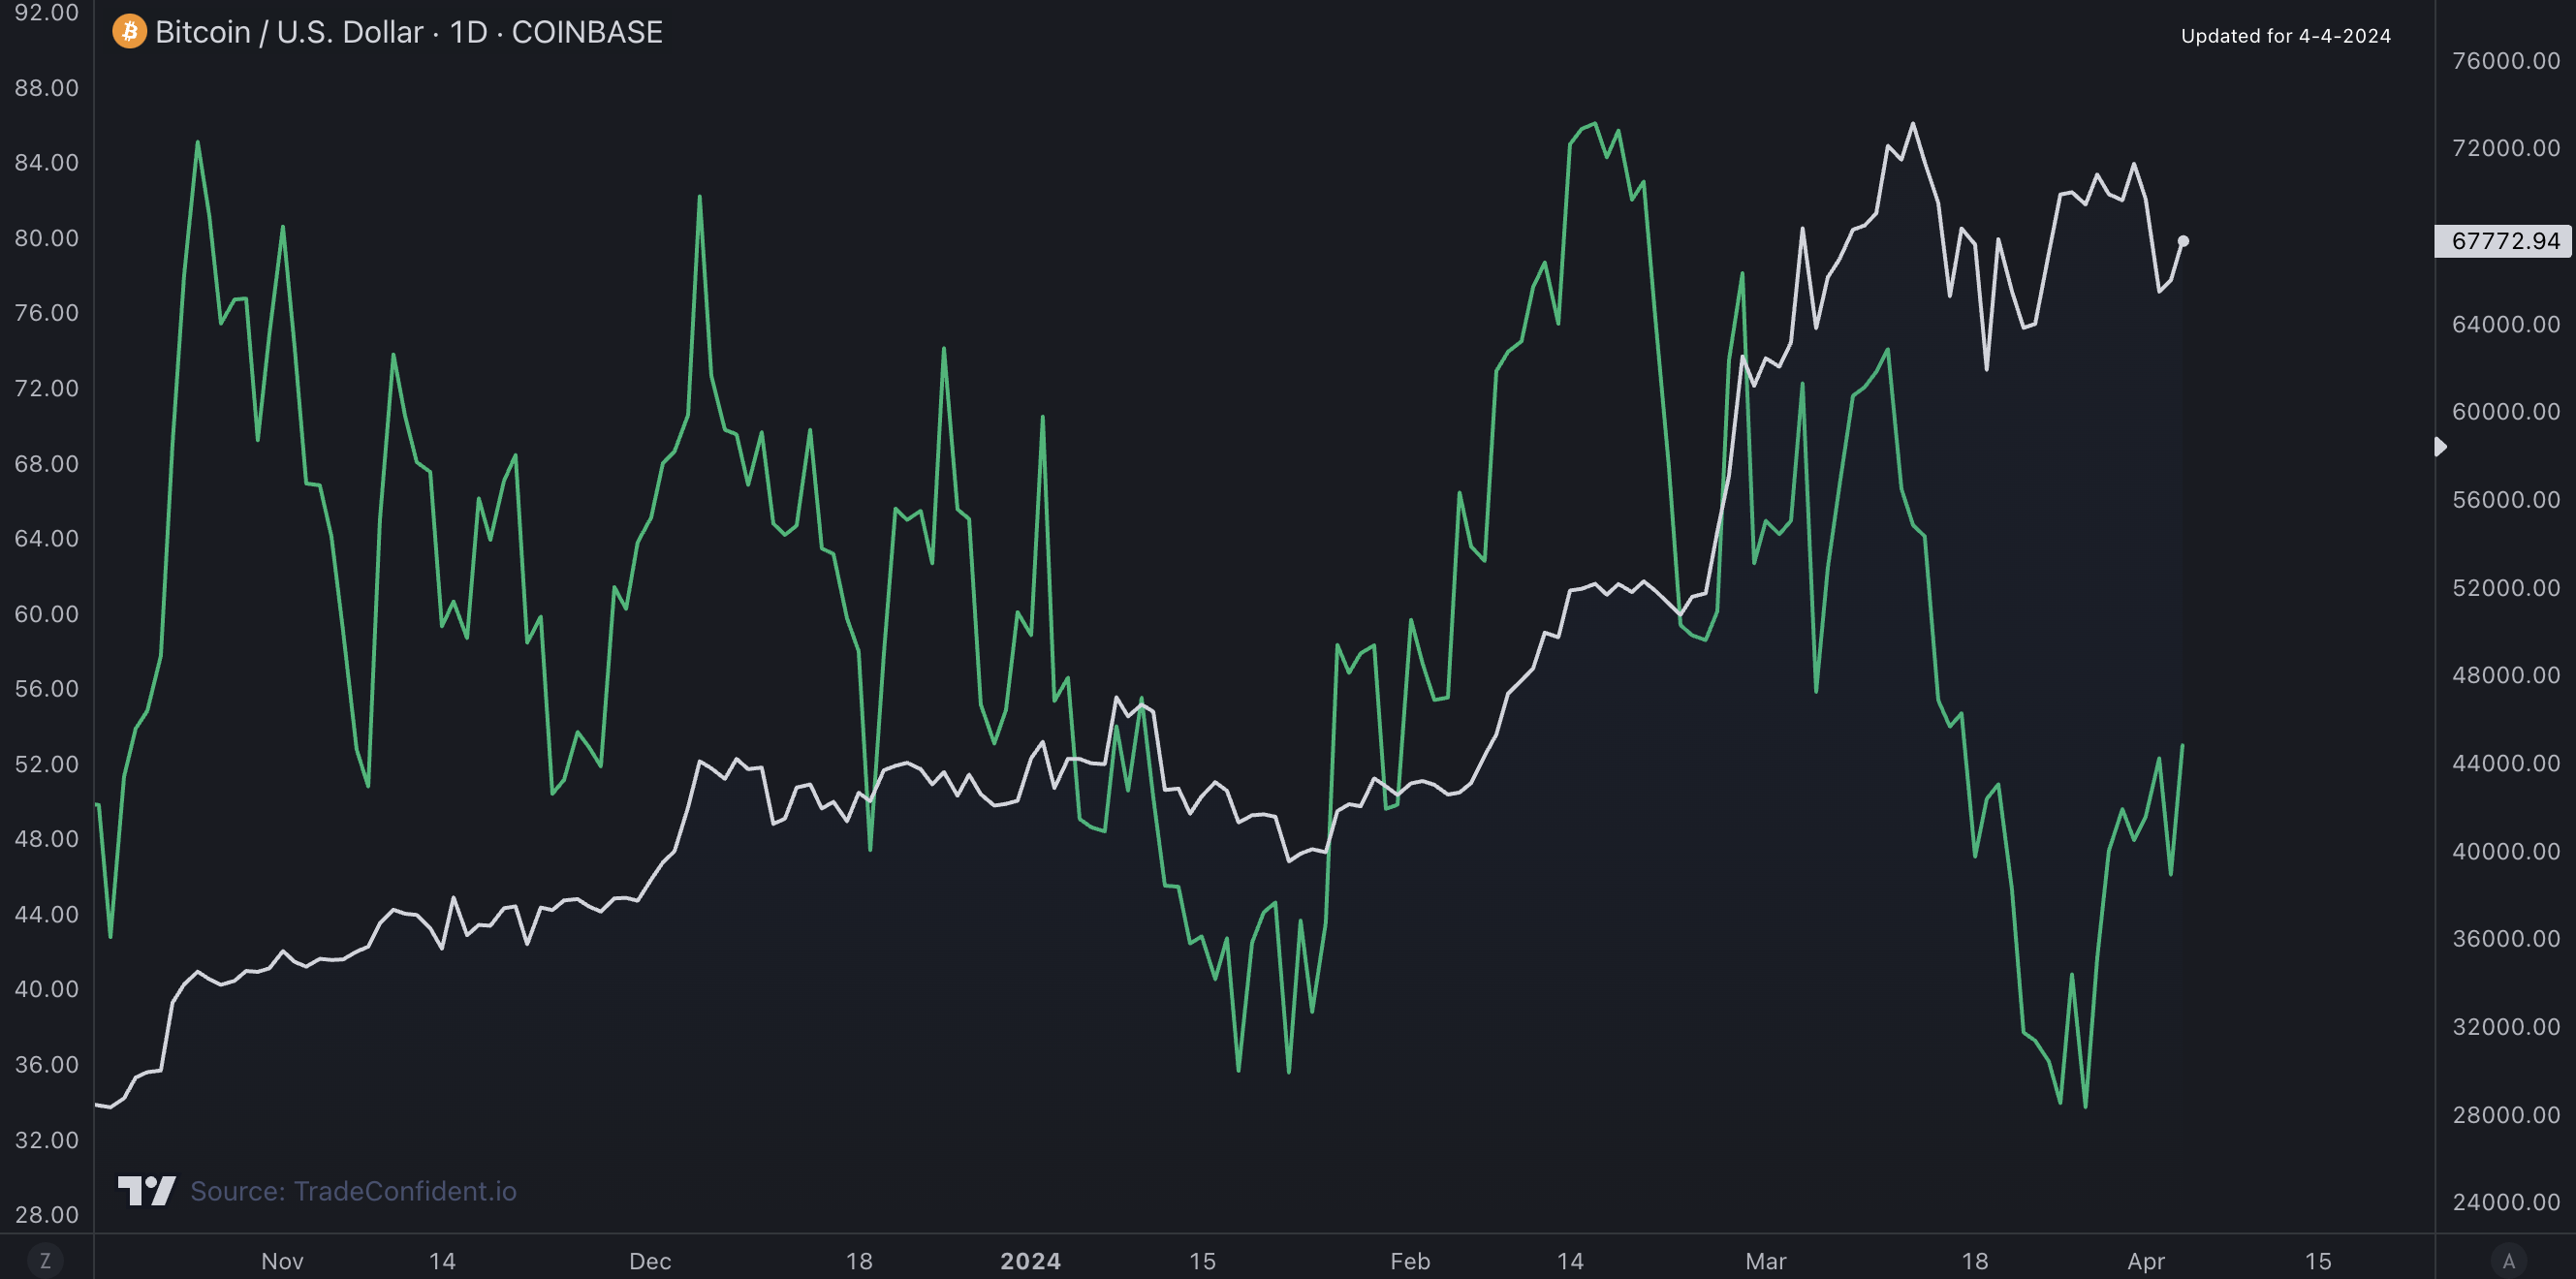
White: Price | Green: Whale Money Flow
When the green line is moving up, this means whale money is flowing into the asset and is therefore bullish. When the green line is moving down, this means whale money is flowing out of the asset and is therefore bearish.
When the price is moving up, while the whale money flow line in green is moving down, this means money is moving out of the asset most likely resulting in a move down.
When the price is moving down, while the whale money flow line in green is moving up, this means money is moving into the asset most likely resulting in a move up.
Bitcoin Major Support/Resistance Levels
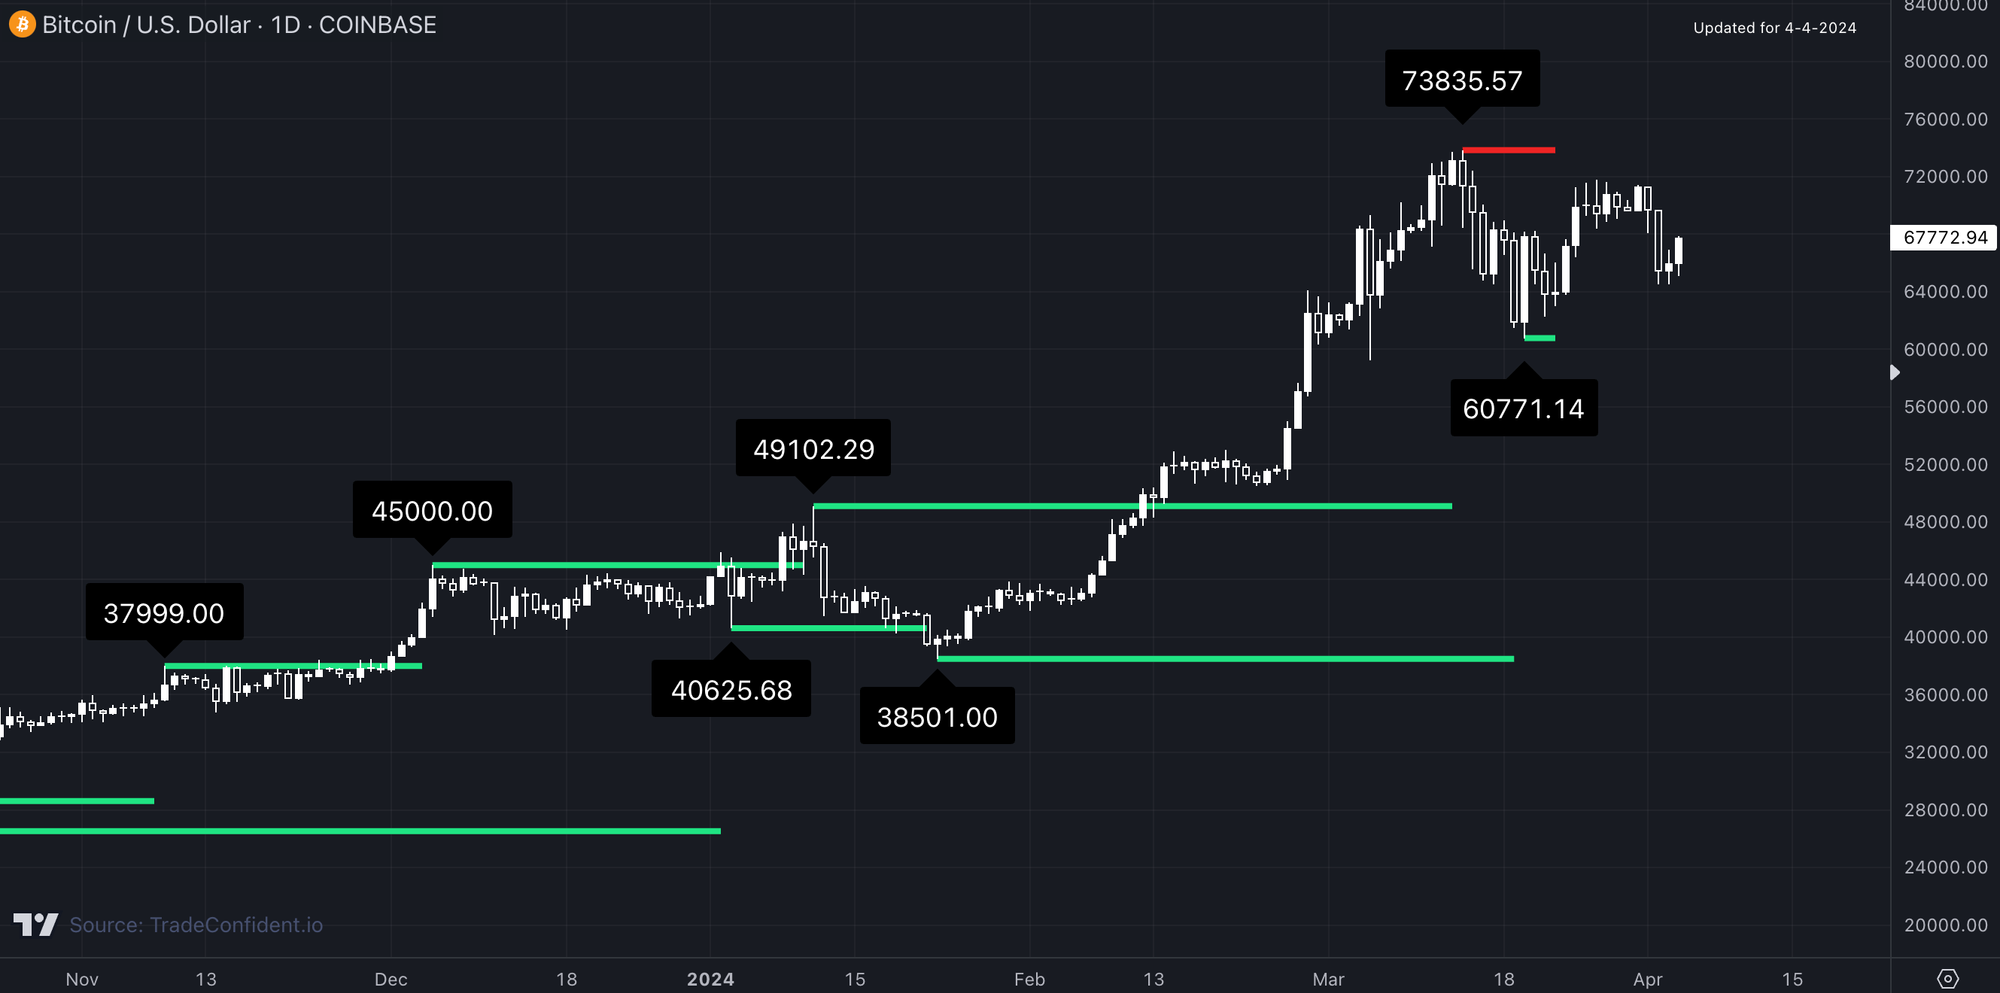
White: Price | Green: Support | Red: Resistance
In green, we have major levels of support, and in red, we have major levels of resistance. Price will typically pause or move down at resistance, and price typically pauses or moves up from support.
How we trade with this metric: Tutorial Video
Bitcoin Trade Signals
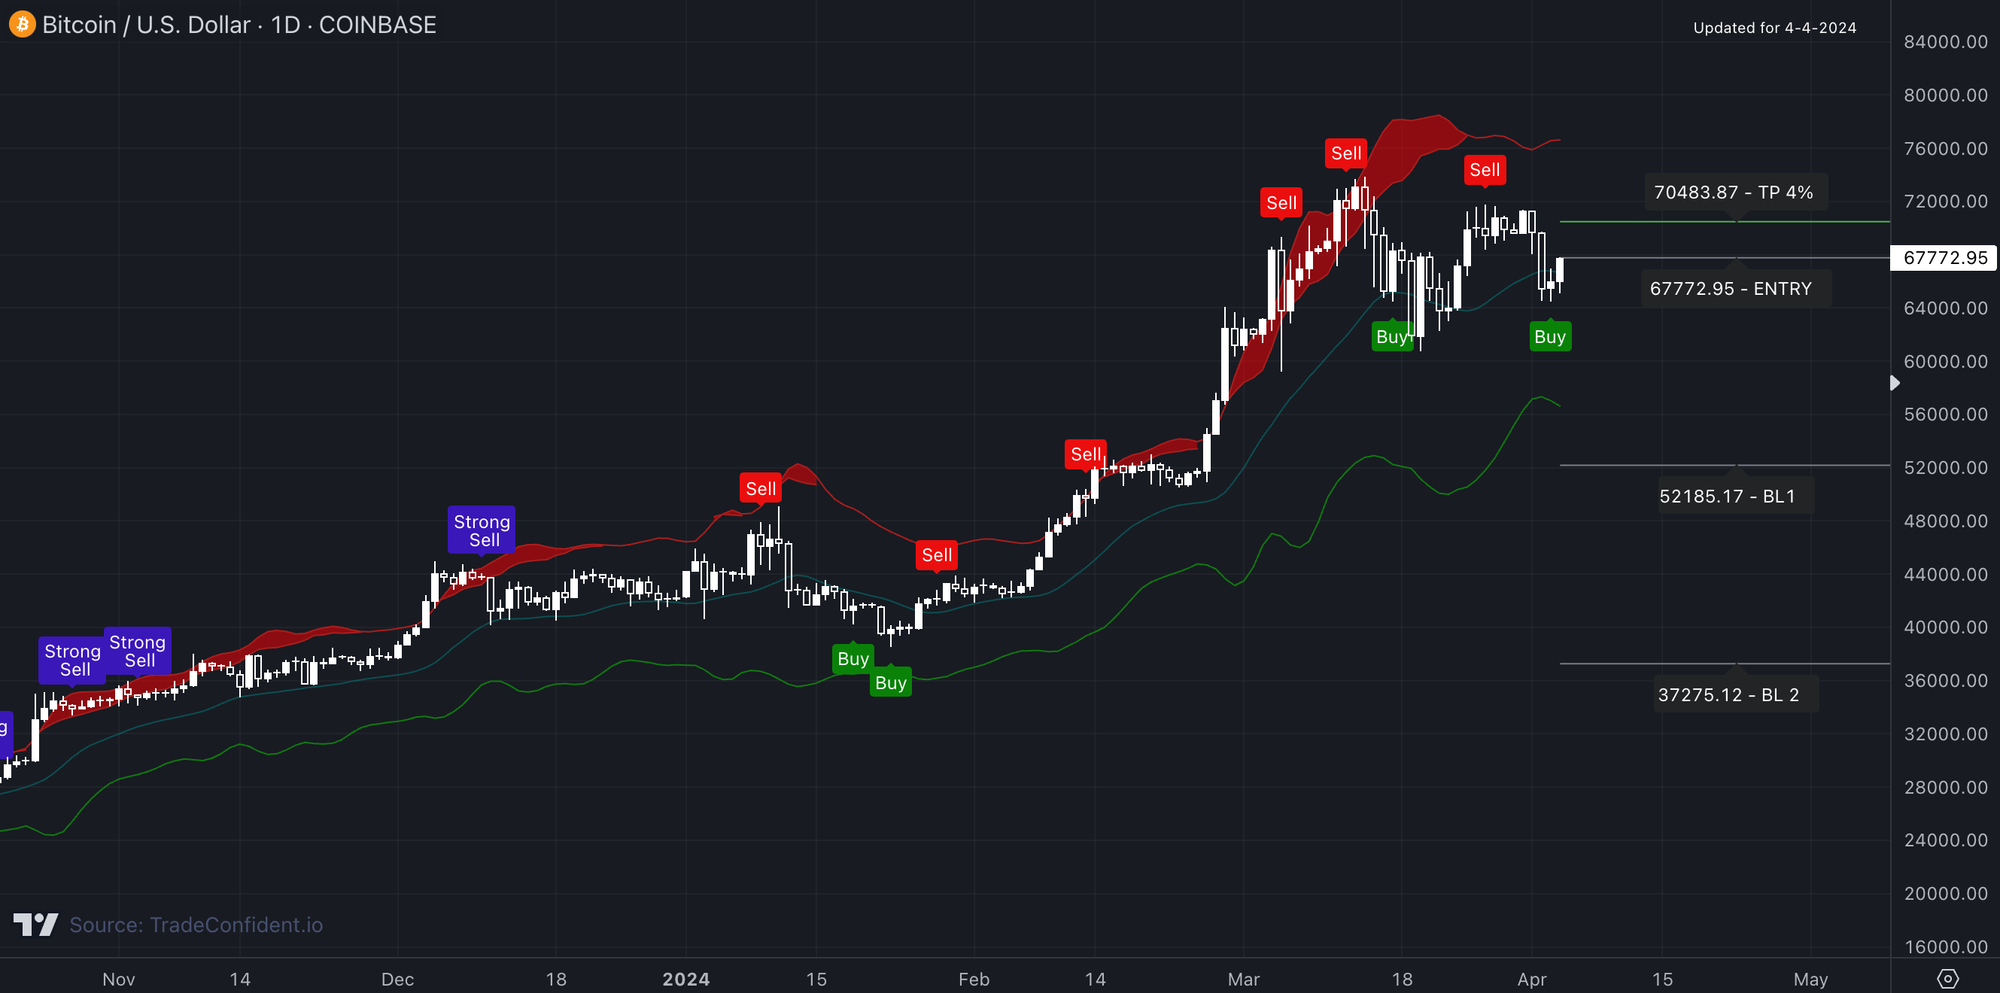
White: Price | Red, Green & Purple: Trade Signals
Trading Strategy: We wait for a Buy or Strong Buy signal to be posted on the bar immediately to the left of the live bar. We use at least 3 BL (Buy Limits) and the TP (Take Profit) level provided for risk management. If a Buy Limit is hit, we use the Break-Even Calculator to calculate our new break-even entry and TP level. We also use the metrics above (or indicators) as supporting evidence to increase the chances of a winning trade! 🎥 Watch a quick tutorial video of how this works!
You can get the TradingView version of this metric here and it will show you live Buy, Strong Buy, Sell, Strong Sell, Take Profit and Buy Limit levels for any crypto on any timeframe and allows for alerts to be sent to your phone, computer or email when a signal appears. It's awesome!!
Disclaimer: The information on this page is not intended as financial, investment or trade advice. By viewing this page you are agreeing to the website's Disclaimer and Terms and Conditions. The explanations of how each metric works are based on personal opinions and are not meant as trade advice. Chart pricing, frame, dominance, total market cap, stablecoin inflow and outflow, and long vs. short trade data sourced from TradingView and their integrated exchanges. All other indicators and metrics are proprietary code belonging to Trade Confident LLC.

