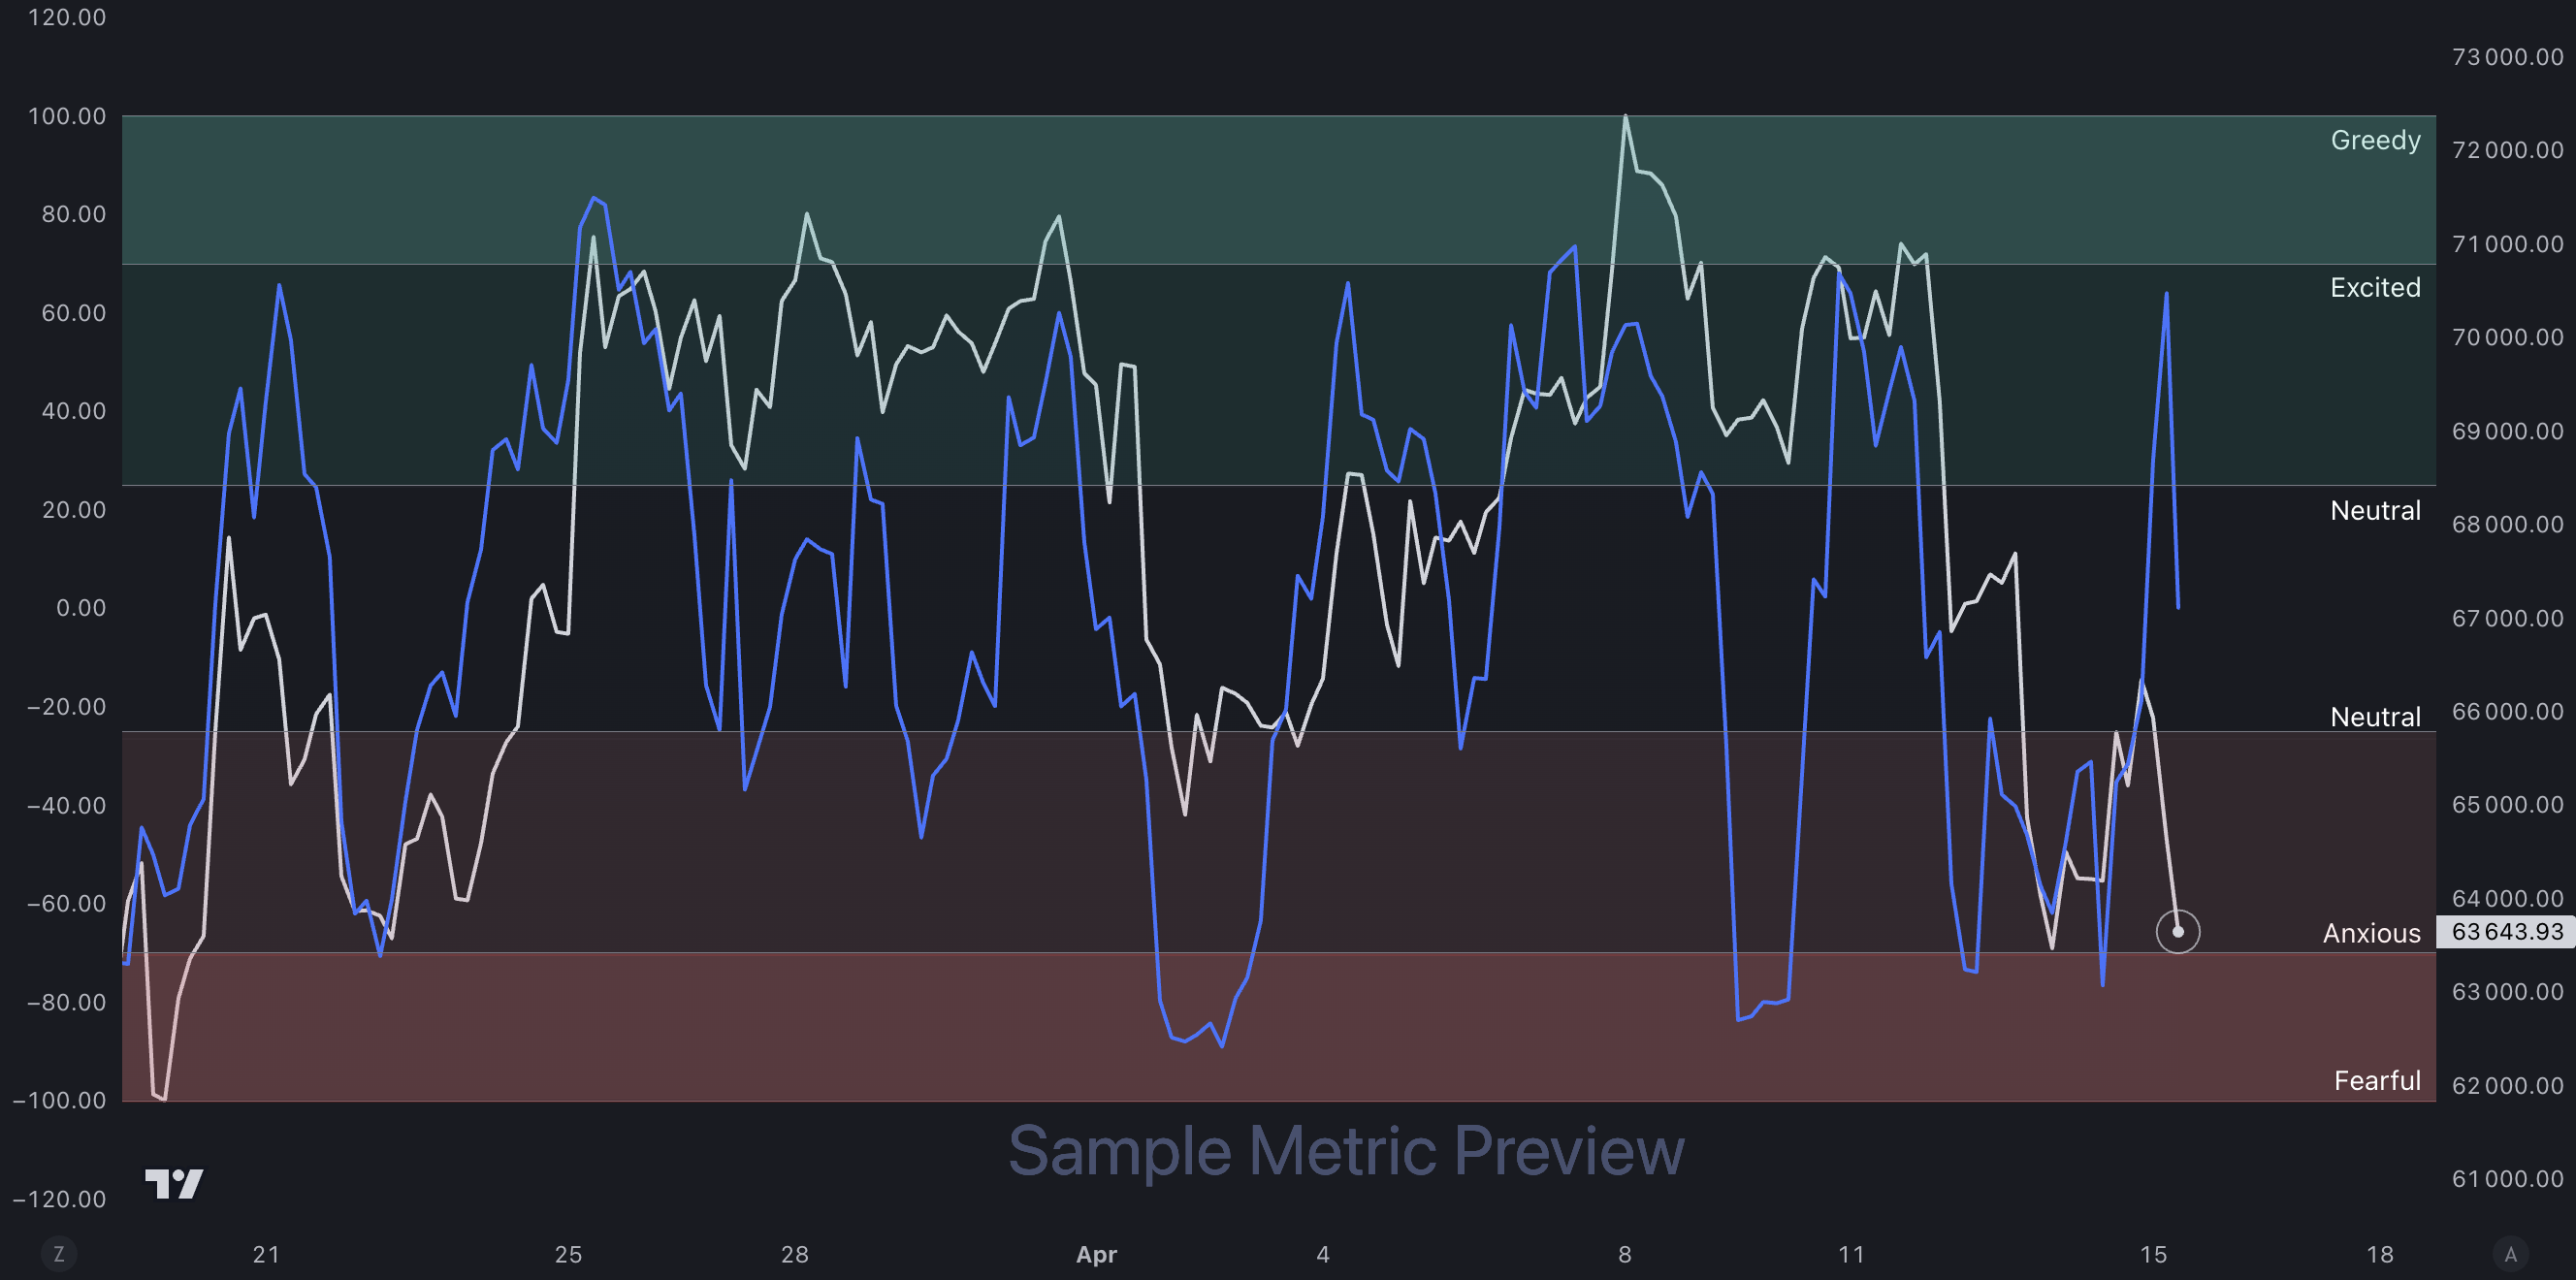
Bitcoin Emotional Index

Subscribe to view all content!
Sign up now. Information available for Full Access tier only.
Subscribe for Access
Already have an account?
Sign in


Sign up now. Information available for Full Access tier only.
Subscribe for Access🏆 28-Month Trading Record: 294 Wins/ 0 Losses
🎇 Our 4th of July "$650 Off " Indicator Sale Ends Friday!!