
Welcome to the Trade Confident Metric Suite, fully integrated with TradingView.
You can now follow the same live TradingView charts used in our Future Forecasts. If you want the most accurate Bitcoin cycle top and bottom signals, monitoring the charts yourself with live alerts is a must!
The Following Charts Are Available For Purchase:
Bitcoin Puell Multiple
This looks at miner revenue (how much money miners make from creating new Bitcoins each day) compared to its average over the past year.
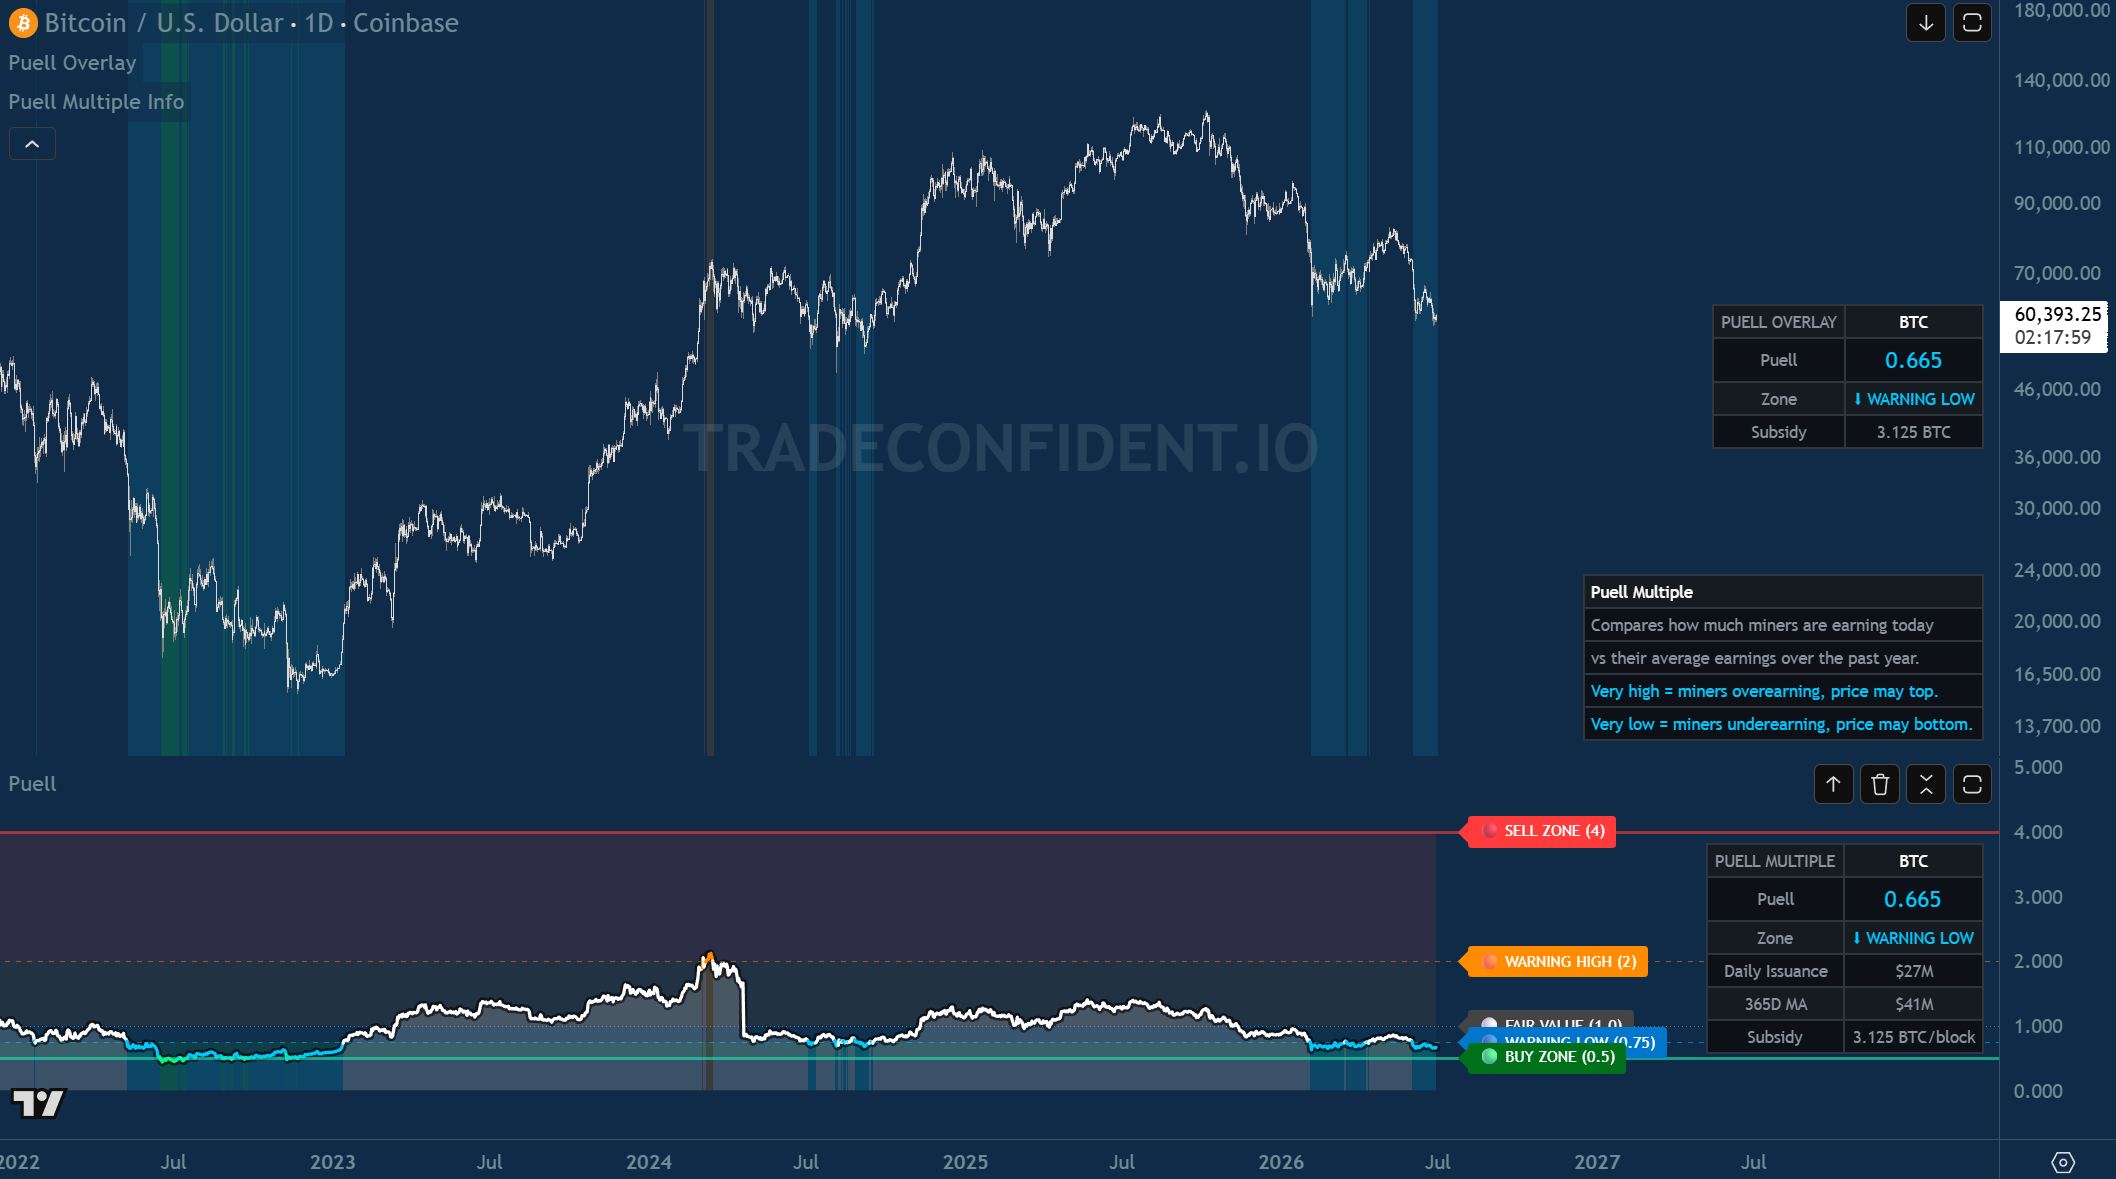
High number = miners are making way more money than usual → could signal a market top (lots of selling pressure coming).
Low number = miners struggling → often a good time to buy (bottoms).
Simple: "Are miners printing money or barely surviving?"
Bitcoin Realized Price
The average price at which all existing Bitcoins were last bought or moved (not the current market price).
It’s like the "true cost basis" of everyone holding Bitcoin.
If current price > realized price → most people are in profit.
If below → many are underwater.
Simple: "What did people actually pay on average for their BTC?" (Repeated twice in your list—it's the same metric.)
Bitcoin % Supply in Profit vs Loss
What percentage of all Bitcoins are currently worth more (profit) or less (loss) than when they last moved on the blockchain.
Near 100% in profit = bull market euphoria.
Lots in loss = fear, possible bottom.
Simple: "How many coin owners are happy vs. bag-holding right now?"
Bitcoin NUPL
Overall "paper" profit or loss across the entire Bitcoin market (market cap minus what everyone paid, divided by market cap).
Ranges from negative (everyone losing money) to very high positive (massive greed).
Simple: "If everyone cashed out today, would the market be celebrating or panicking?" Great for spotting tops and bottoms."
Bitcoin 52 Week Sharpe Ratio
Measures Bitcoin's return vs. risk (volatility) over the past year.
Higher = better returns for the wild swings you're taking.
Lower = you're getting lousy reward for all the stomach-churning ups and downs.
Simple: "Is Bitcoin worth the rollercoaster right now compared to the last year?" (Like a risk-adjusted grade for the investment.)
Bitcoin CVDD
Tracks old coins moving to new owners, weighted by how long they were held and at what dollar value.
It has historically nailed market bottoms very well.
Simple: "When long-time holders finally sell their ancient coins, it often marks the end of a crash."
Bitcoin Electrical Cost
Rough estimate of what it costs miners to produce one Bitcoin, mostly electricity.
Price rarely stays below this for long (miners shut off machines).
Simple: "The break-even line for miners—acts like a natural support floor for the price."
Bitcoin SOPR
When coins actually move (people sell/spend), are they selling at a profit or loss?
Above 1 = sellers mostly in profit.
Below 1 = sellers taking losses.
Simple: "Are people capitulating and selling at a loss or profit. Possibly the single greatest metric here to pinpoint market pivots and a high reward-to-risk ratio."
Bitcoin MVRV Z Score
Compares current market price to the "real" average purchase price, adjusted for how extreme it is historically.
Very high = extremely overvalued (sell zone).
Very low/negative = undervalued (buy zone).
Simple: "How far above or below 'fair value' is Bitcoin right now, statistically?" One of the best valuation tools.
Bitcoin Power Law
This is a long-term price prediction model that says Bitcoin’s price grows according to a mathematical “power law” relationship with time (not linearly or exponentially, but following a steady curve on a log-log chart).
When the price is below the bottom green support, this is typically the time to start heavily acquiring Bitcoin and Altcoins.
PLEASE NOTE: You are not downloading the source code for these metrics. Instead, you'll receive TradingView chart links that you can:
- Save as your own TradingView chart layouts
- Bookmark in your browser
- Save to your desktop
These charts update live, allowing you to monitor each on-chain metric in real time.
⚠️ Important: Make A "Copy" Of The Charts
After opening each chart in the download file, click "Copy" in the upper-right corner to save a copy to your own TradingView account.
This step is required. If you don't make a copy, you may lose access to the chart in the future.
Please check your TradingView plan to see how many chart layouts your account allows you to save.
A free TradingView account can still view the charts, but only users who create their own copy of each chart are guaranteed continued access.
If you have a paid TradingView plan, you can also set alerts on multiple charts to receive notifications when potential Bitcoin market tops or bottoms are signaled.
What you're paying for: The on-chain metrics included in this package are based on publicly available blockchain data and are not proprietary formulas or source code. Your purchase is not for ownership of the underlying metric calculations. Rather, you are paying for the significant time and expertise invested in integrating these metrics into live TradingView charts, creating custom visual layouts, alert functionality, optimizing the user experience, maintaining the charts, and providing them in an easy-to-use format with live updates and alert functionality.

