

This is your best chance of timing the Bitcoin and Altcoin cycle top and bottom. Included Metric Charts:
Electrical Cost, Weekly
NUPL (Net Unrealized Profit/Loss), Weekly
SOPR (Spent Output Profit Ratio), Daily
52-Week Sharpe Ratio, Daily
CVDD (Coin Value Days Destroyed), Weekly
% Supply in Profit vs Loss, Daily
Realized Price, Weekly
Power Law, Weekly
Puell Multiple, Daily
MVRV Z-Score, Weekly
If you would like to track these TradingView metric charts 24/7 on live data, feel free to purchase any of them here.
Charts Updated July 13, 2026 at 3:27pm PT
Bitcoin — Electrical Cost, Weekly
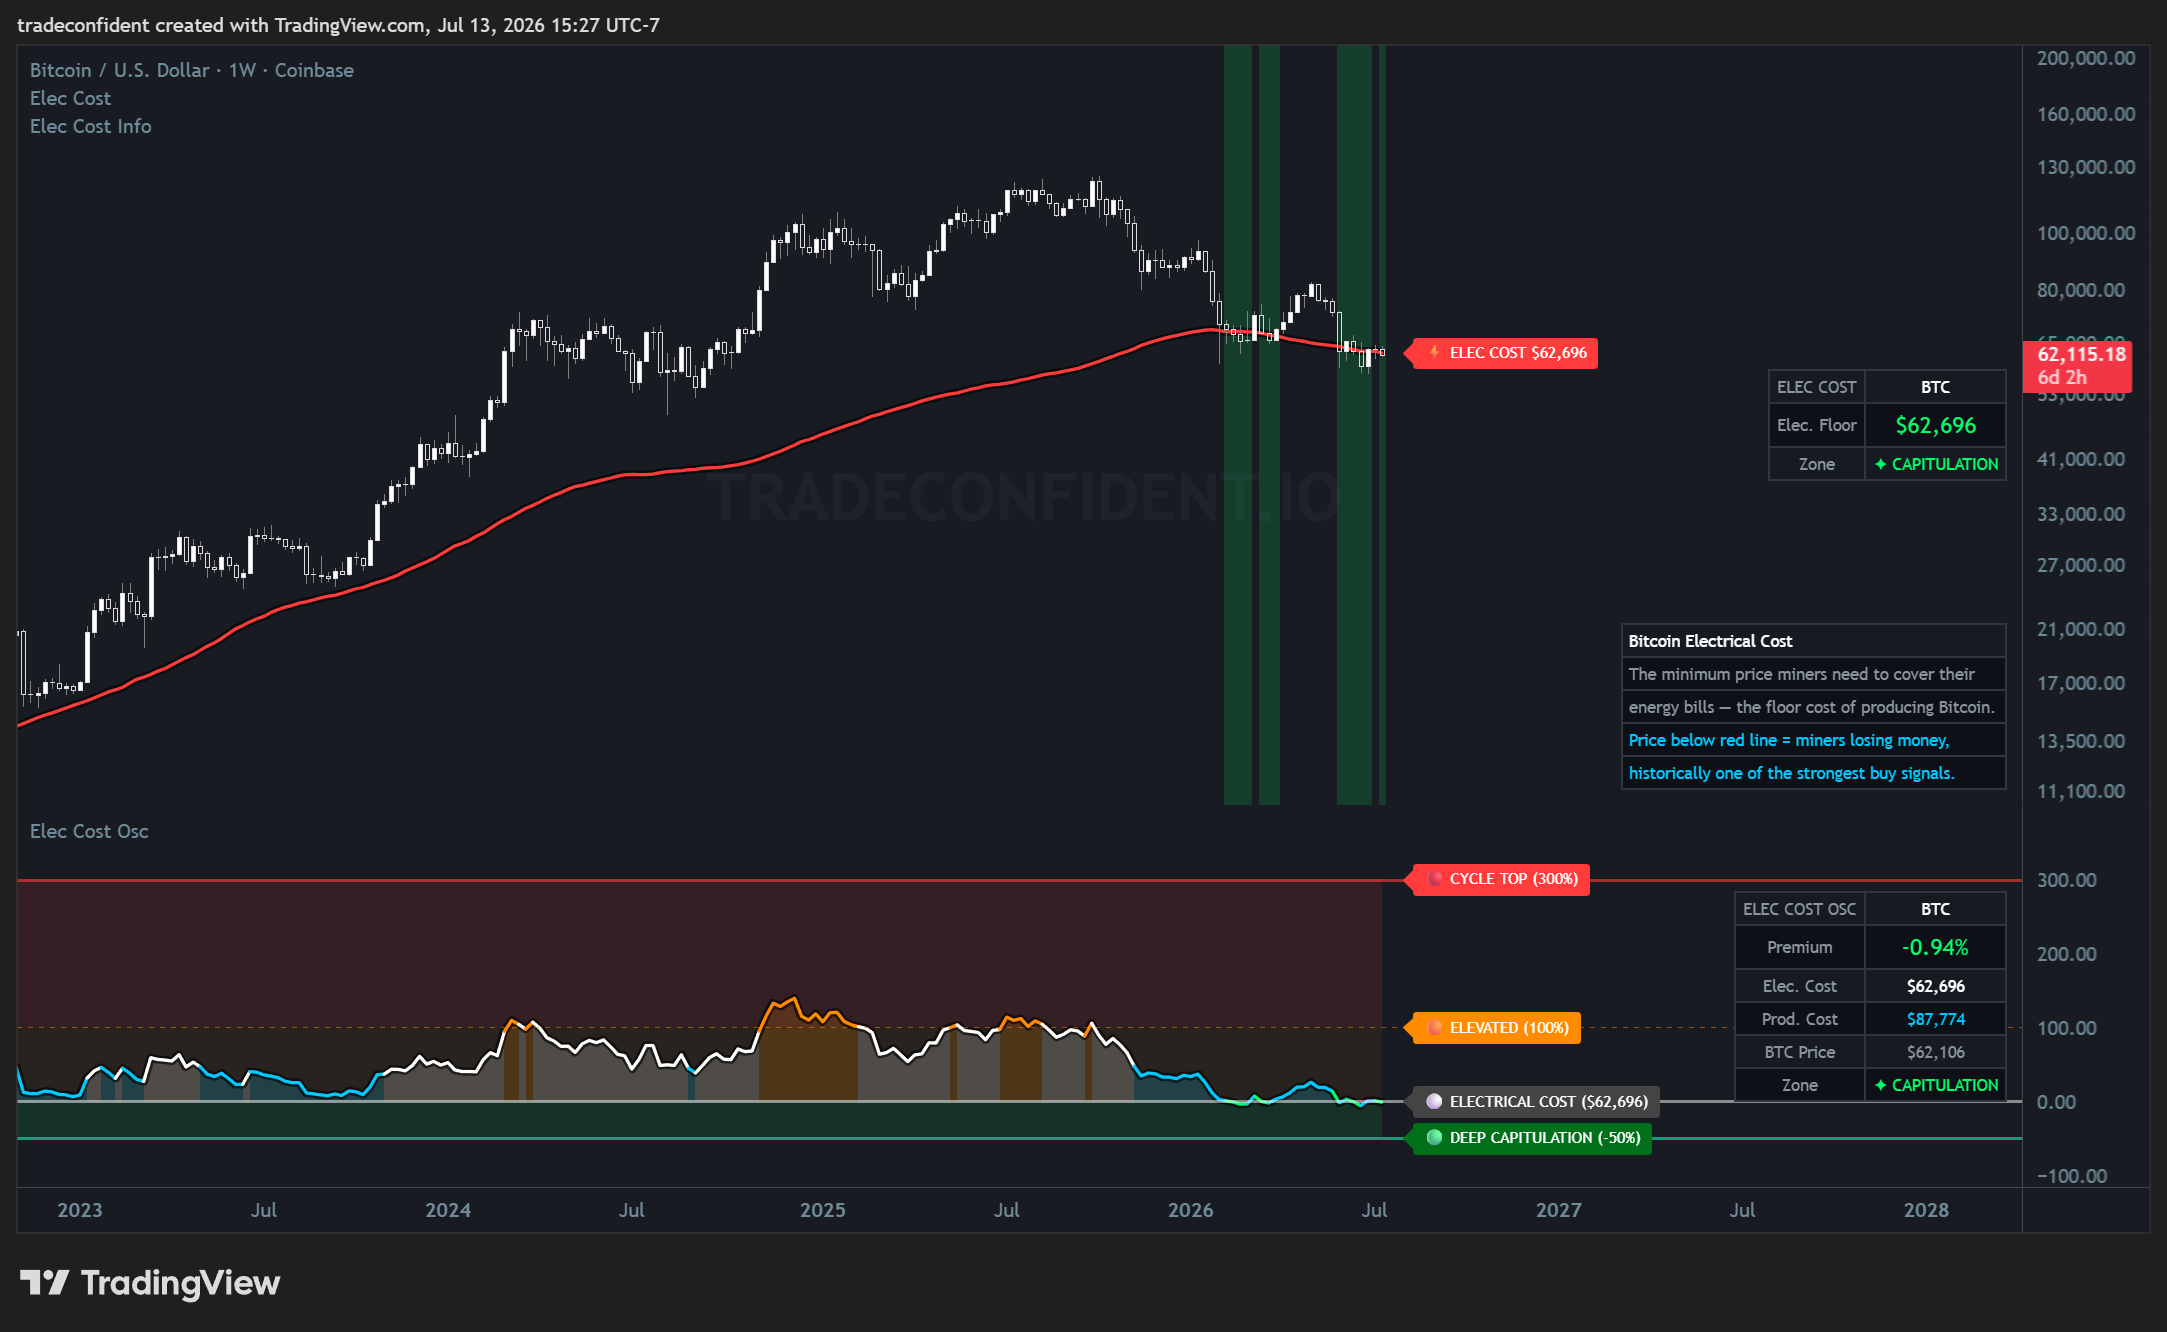
Bitcoin's at $62K, sitting right at the electrical cost floor of $62,696 — the minimum price miners need just to cover their energy bills. The dashboard reads capitulation, and past dips below this red line have been some of the strongest buy signals in Bitcoin's history.
Price can stay under this floor for a while as weaker miners get squeezed out, but historically this zone has rewarded patient accumulation, not financial advice.
Bitcoin — NUPL (Net Unrealized Profit/Loss), Weekly
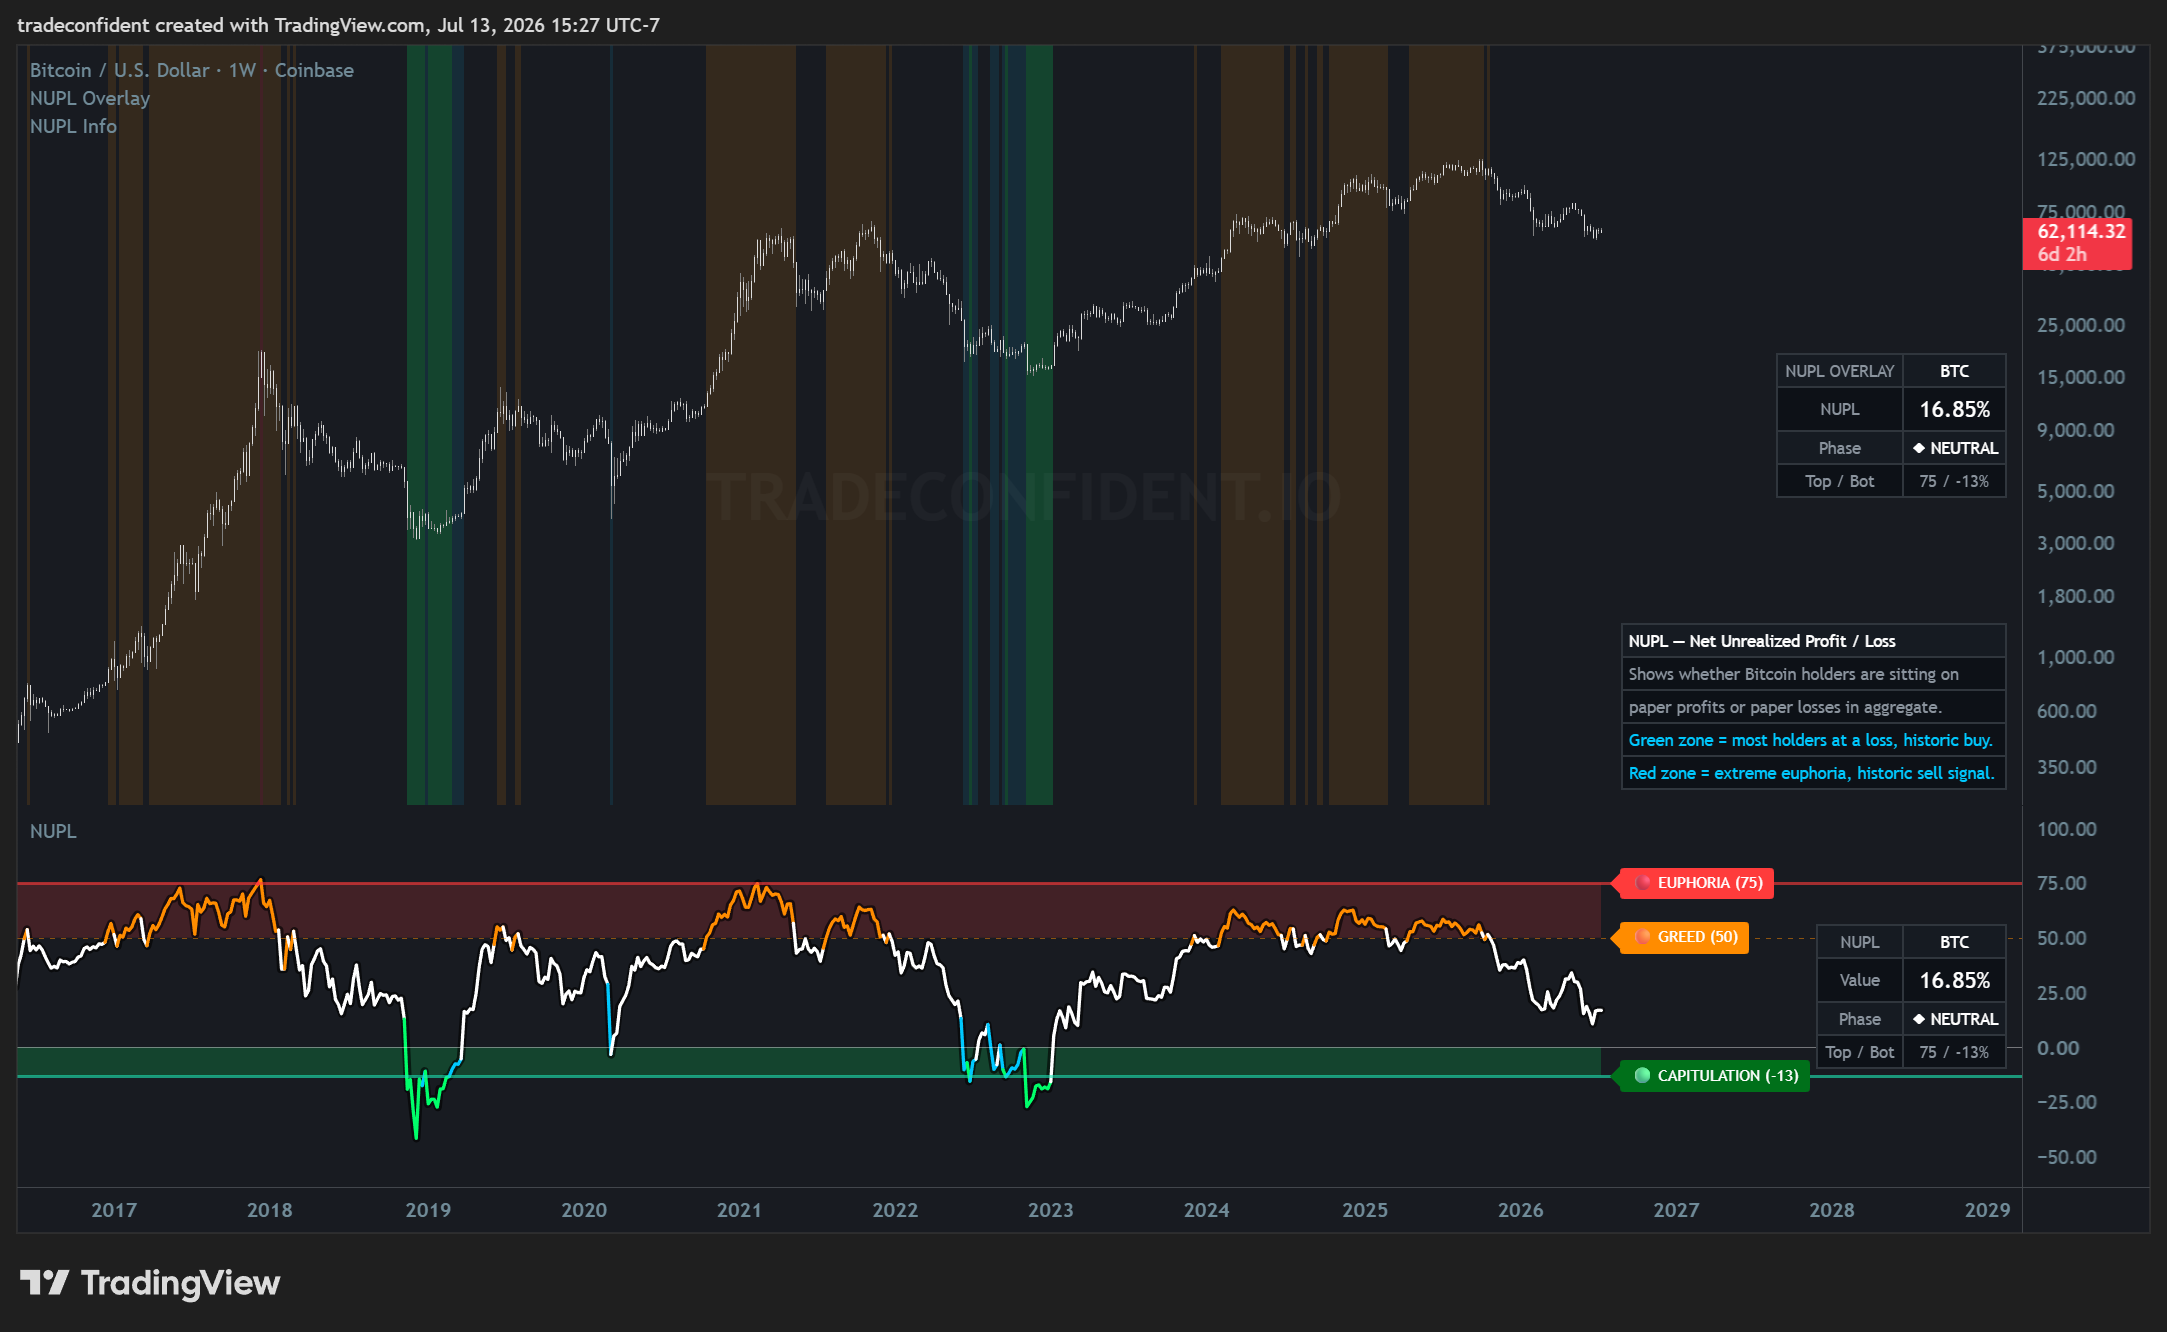
NUPL has dropped to 16.85% — technically neutral, but well off the greed zone that dominated most of this cycle. Full capitulation sits at -13, which marked the 2018 and 2022 bottoms.
Sentiment is clearly washing out, but we haven't hit the historic green buy zone yet. A grind lower into capitulation would be the higher-conviction signal to watch for, not financial advice.
Bitcoin — SOPR (Spent Output Profit Ratio), Daily
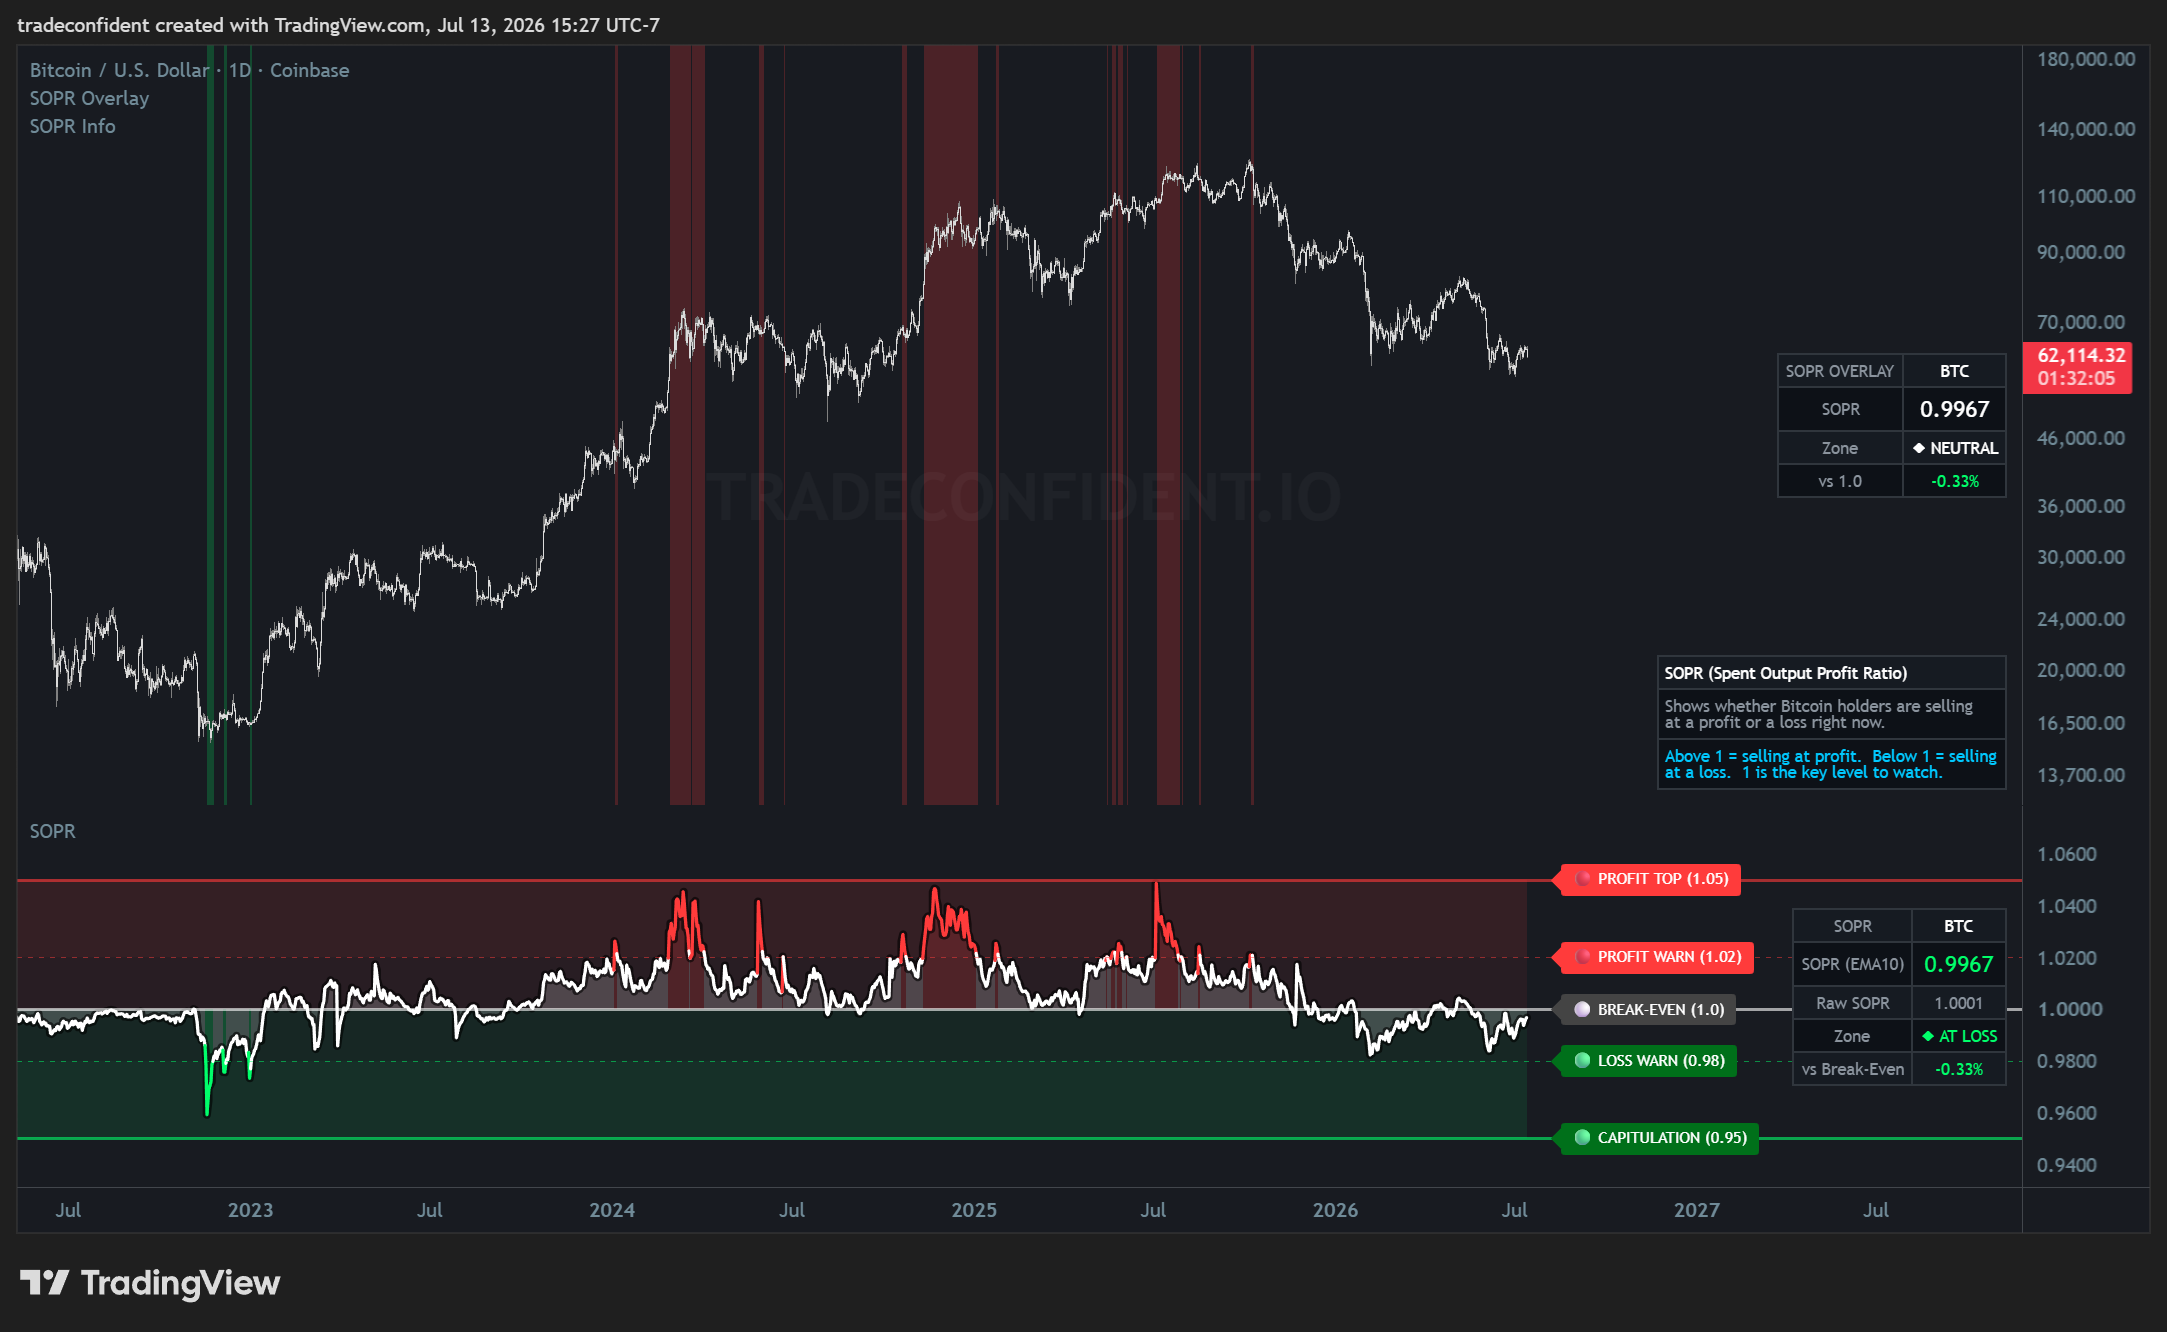
SOPR is at 0.9967, just under the break-even line at 1.0 — meaning coins moving on-chain are being sold at a slight loss on average. Repeated rejections at 1.0 are typical of downtrends, while reclaiming it usually marks the shift back to strength.
Watch for SOPR to hold above 1.0 — that flip has historically confirmed trend recoveries, while a flush toward the 0.95 capitulation line would signal a deeper washout first.
Bitcoin — 52-Week Sharpe Ratio, Daily
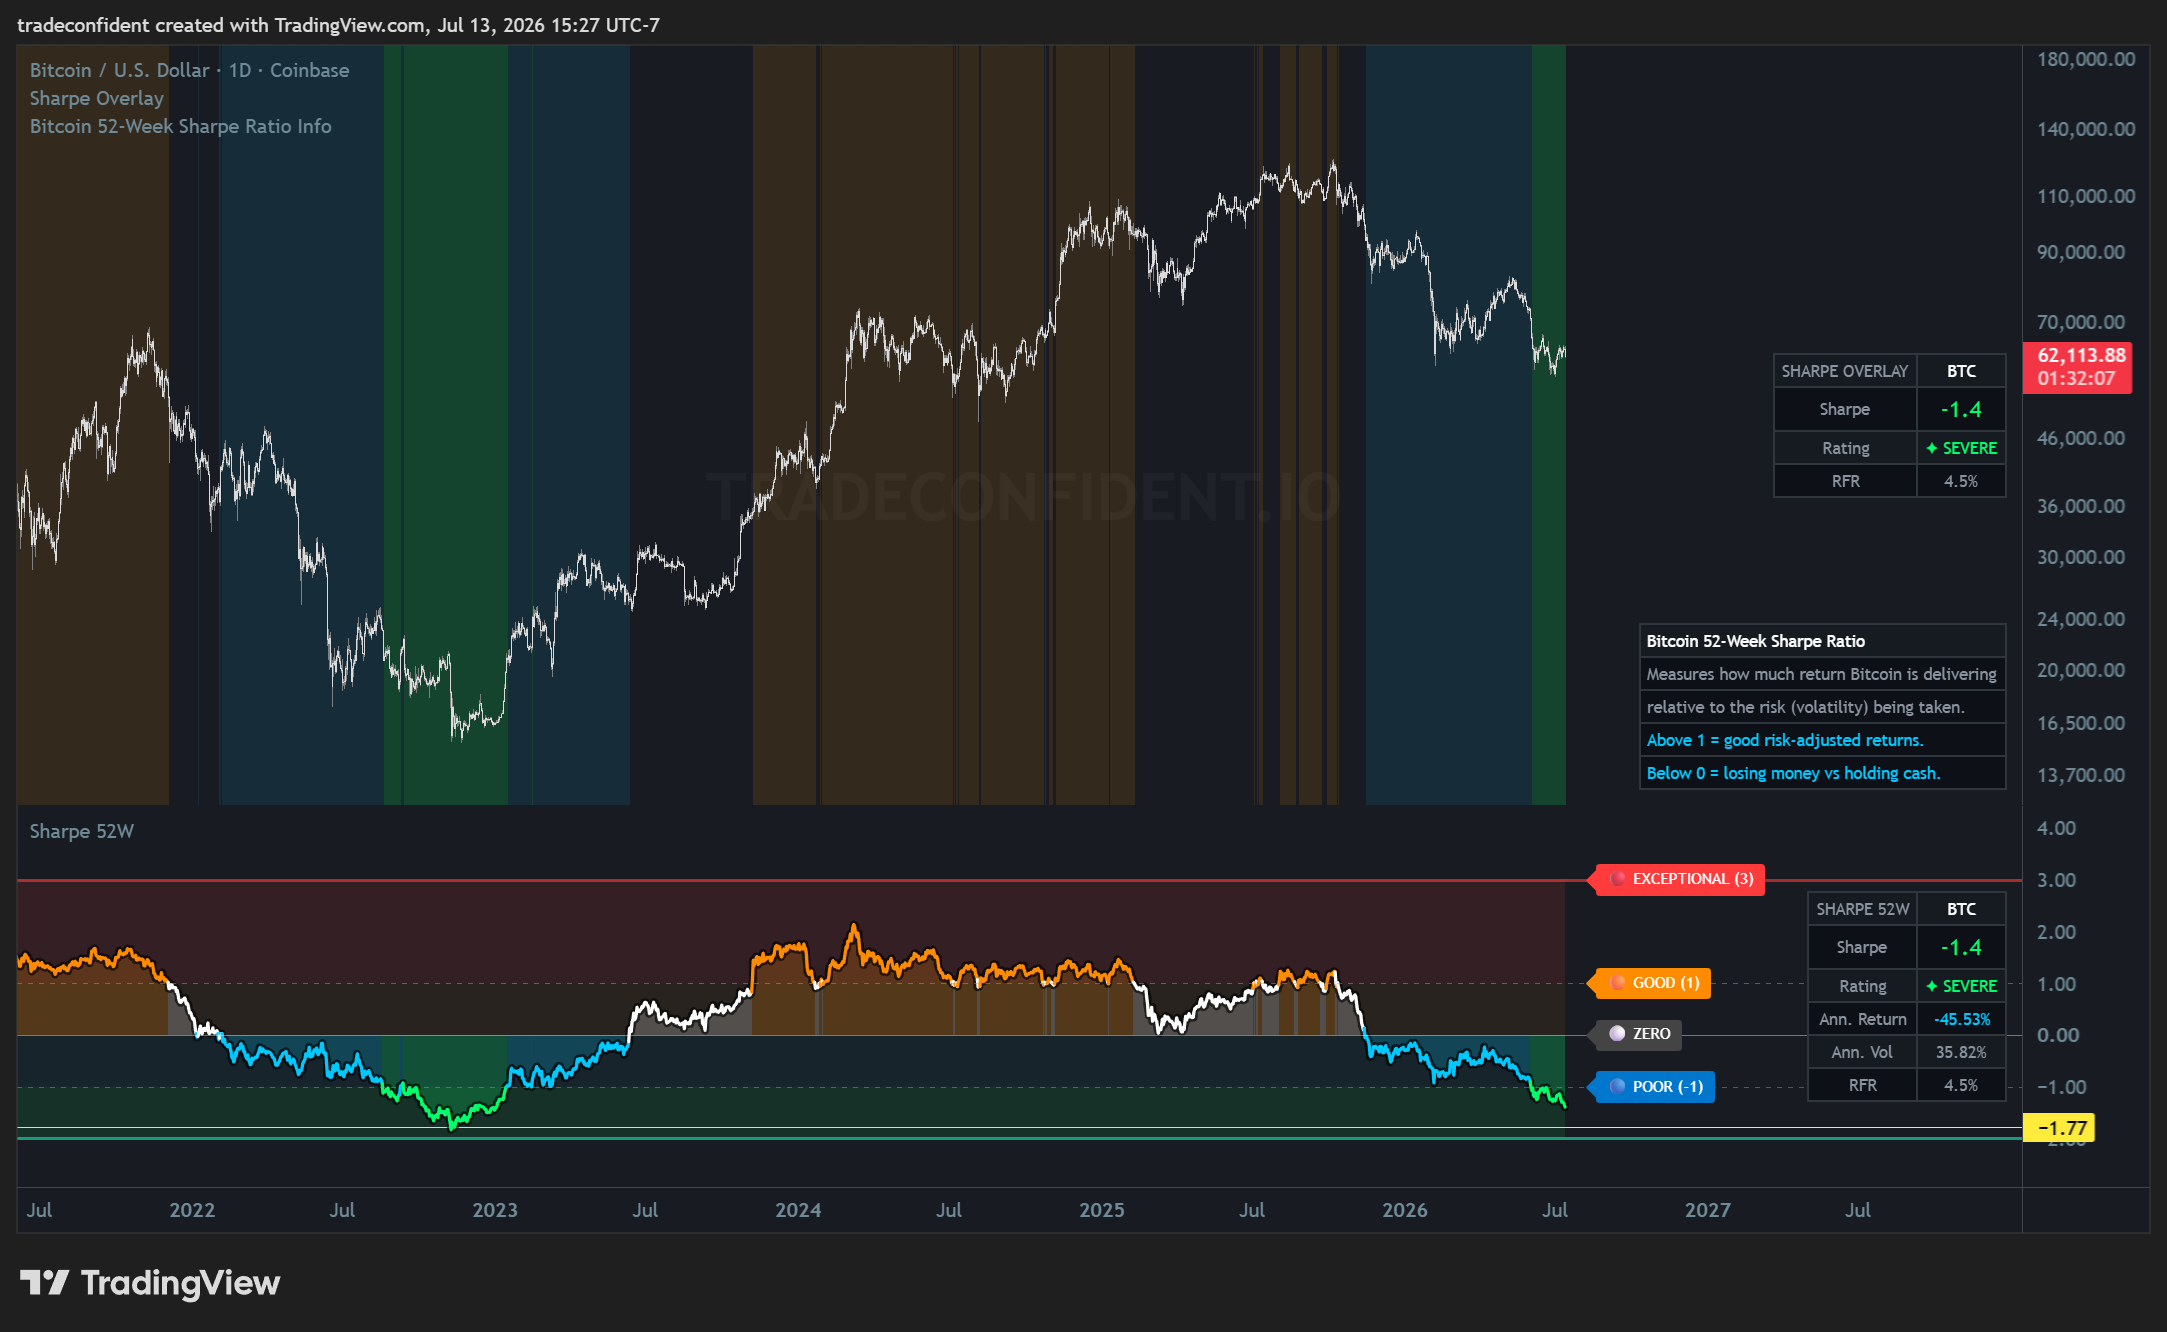
Bitcoin's risk-adjusted returns have collapsed to a Sharpe of -1.4, rated severe, with the trailing year down about 46%. Readings this poor are rare — the last comparable stretch was the late-2022 bear market floor.
Counterintuitively, severe Sharpe readings have historically appeared near bottoms, not tops, because the pain is already priced in. A spot to be building watchlists rather than panic selling, not financial advice.
Bitcoin — CVDD (Coin Value Days Destroyed), Weekly
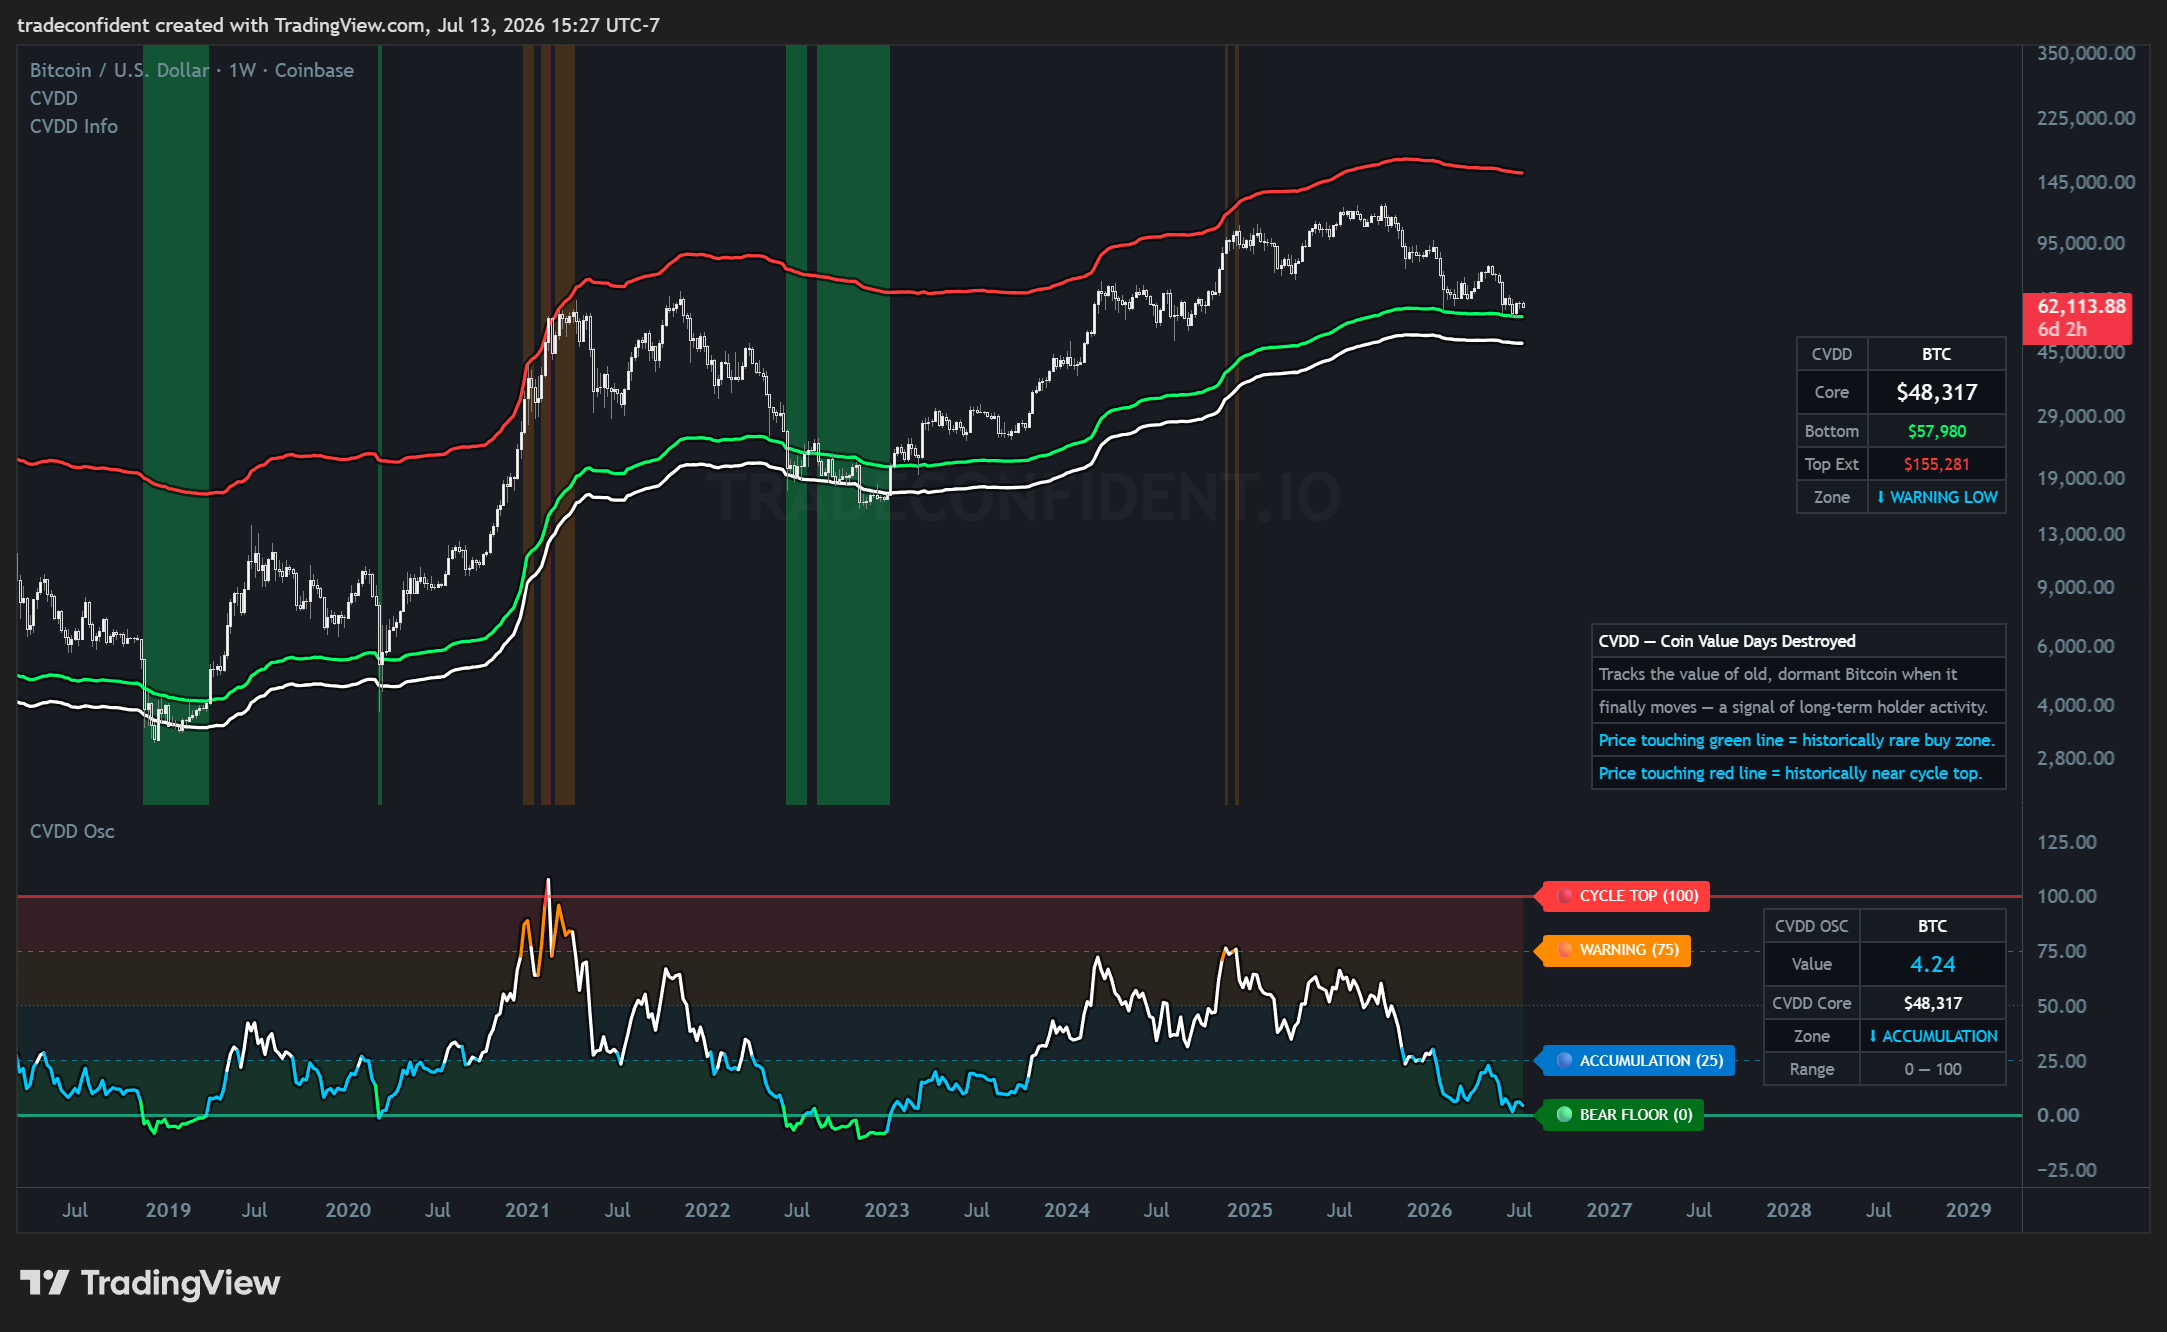
The CVDD oscillator sits at 4.24, deep in the accumulation zone, with the bottom band at $57,980 — just below current price. This metric tracks when old, dormant coins move, and readings near the bear floor have historically lined up with cycle lows.
Price approaching the green CVDD band around $58K has been a historically rare buy zone, so that's the level to watch for scaling in, not financial advice.
Bitcoin — % Supply in Profit vs Loss, Daily
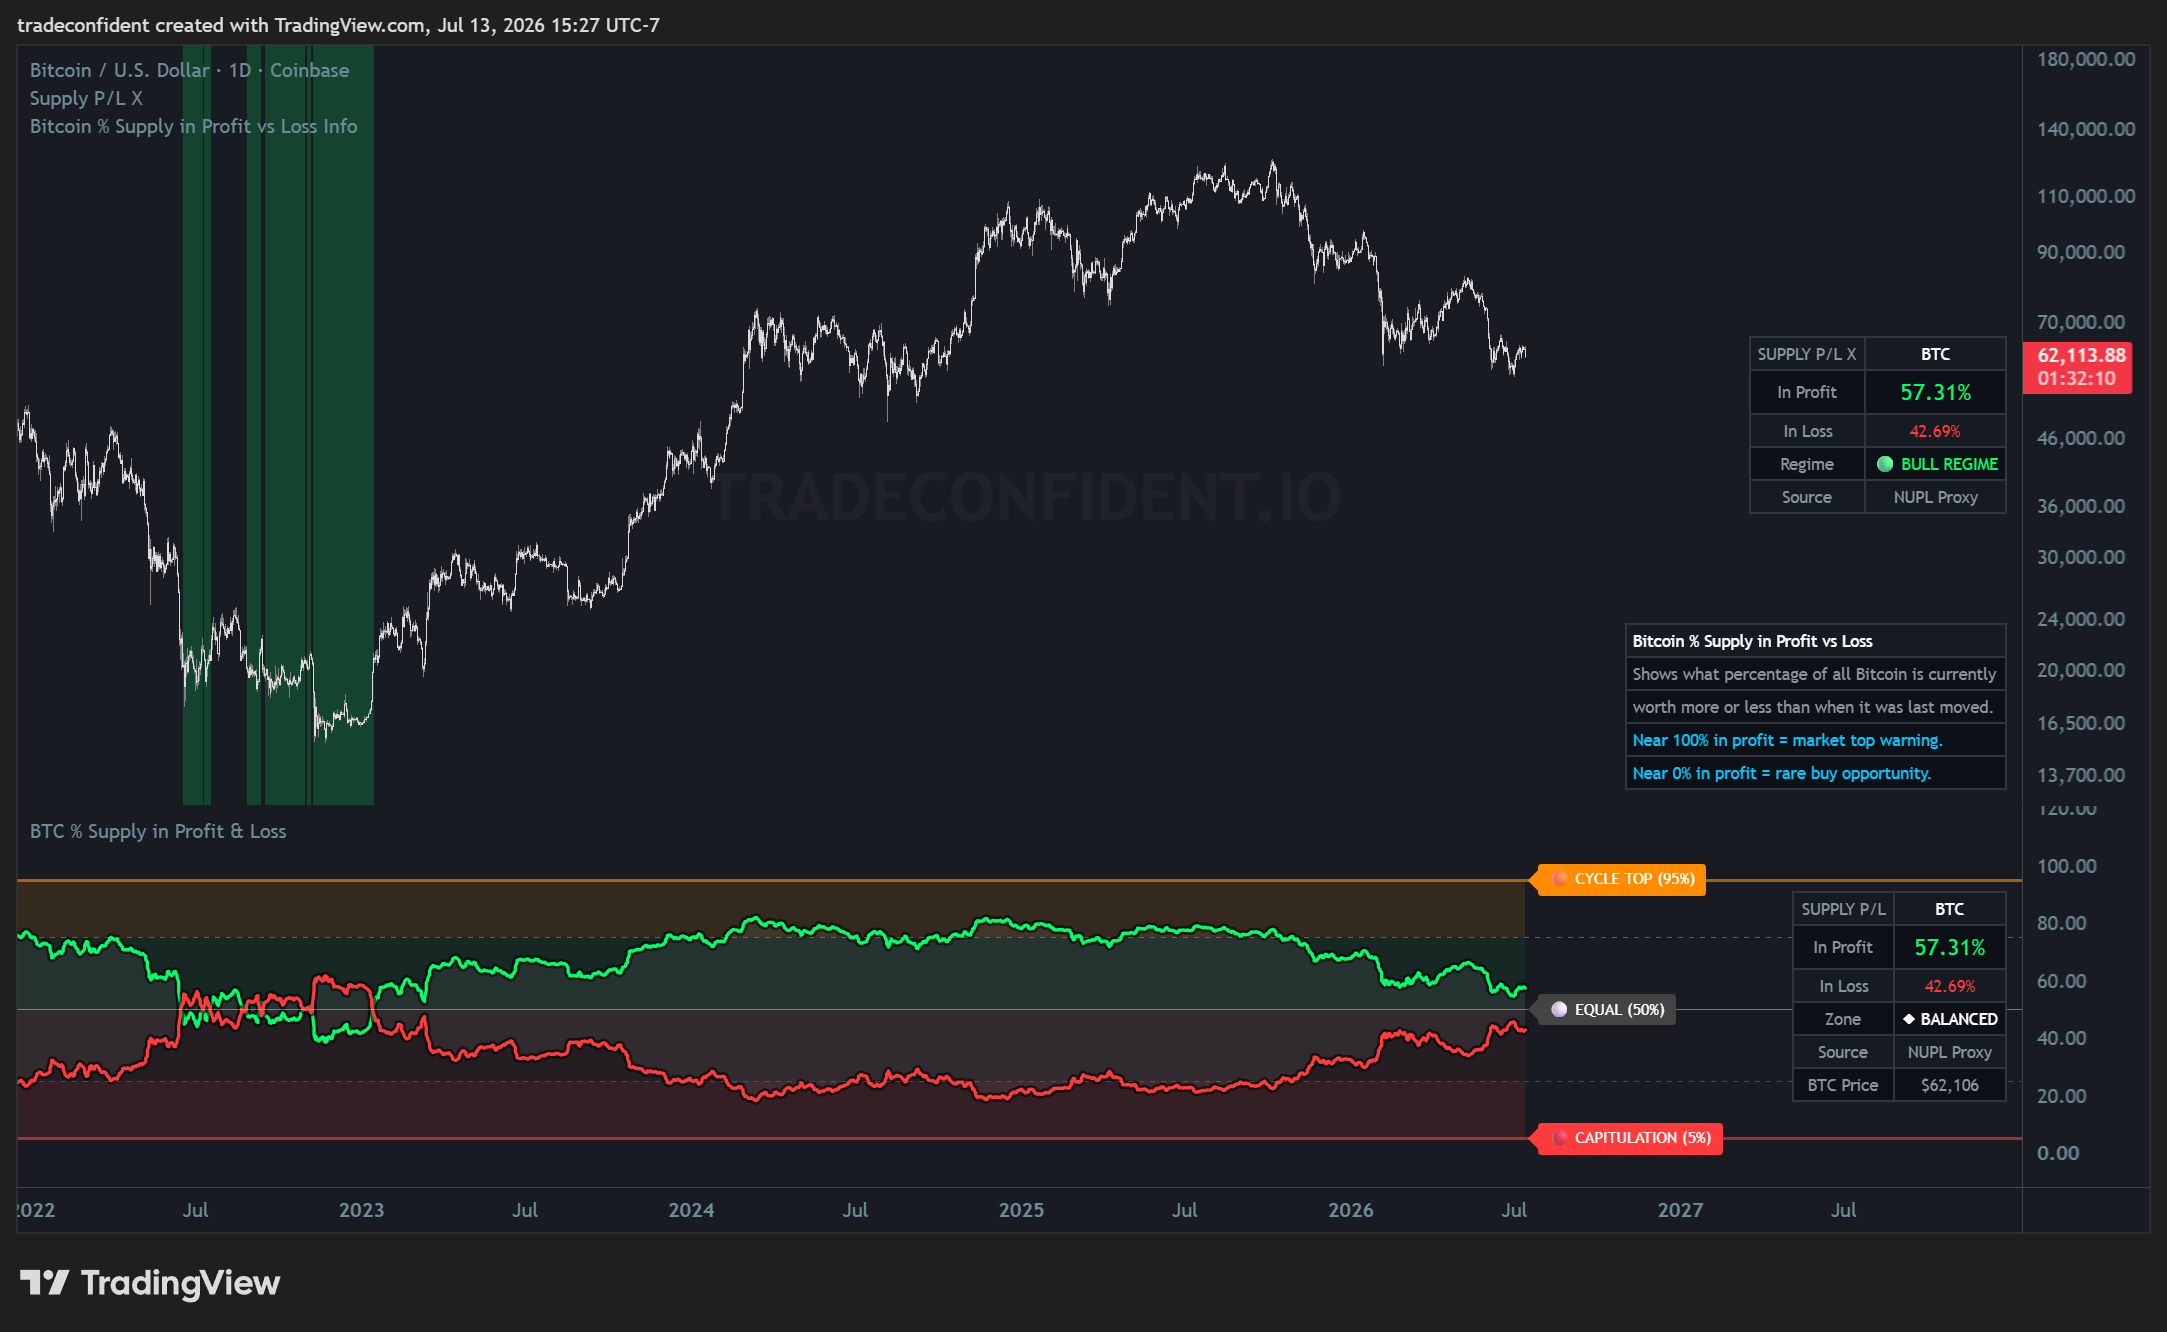
Only 57.3% of all Bitcoin is currently in profit, with 42.7% underwater — a balanced zone, down sharply from the 80%+ readings at the highs. The regime still reads bullish, but holder pain is clearly building.
Past cycle bottoms came when profit supply neared 50% or below, so we're approaching but not yet at the historic extreme. A dip below the 50% equal line would mark the stronger accumulation signal, not financial advice.
Bitcoin — Realized Price, Weekly
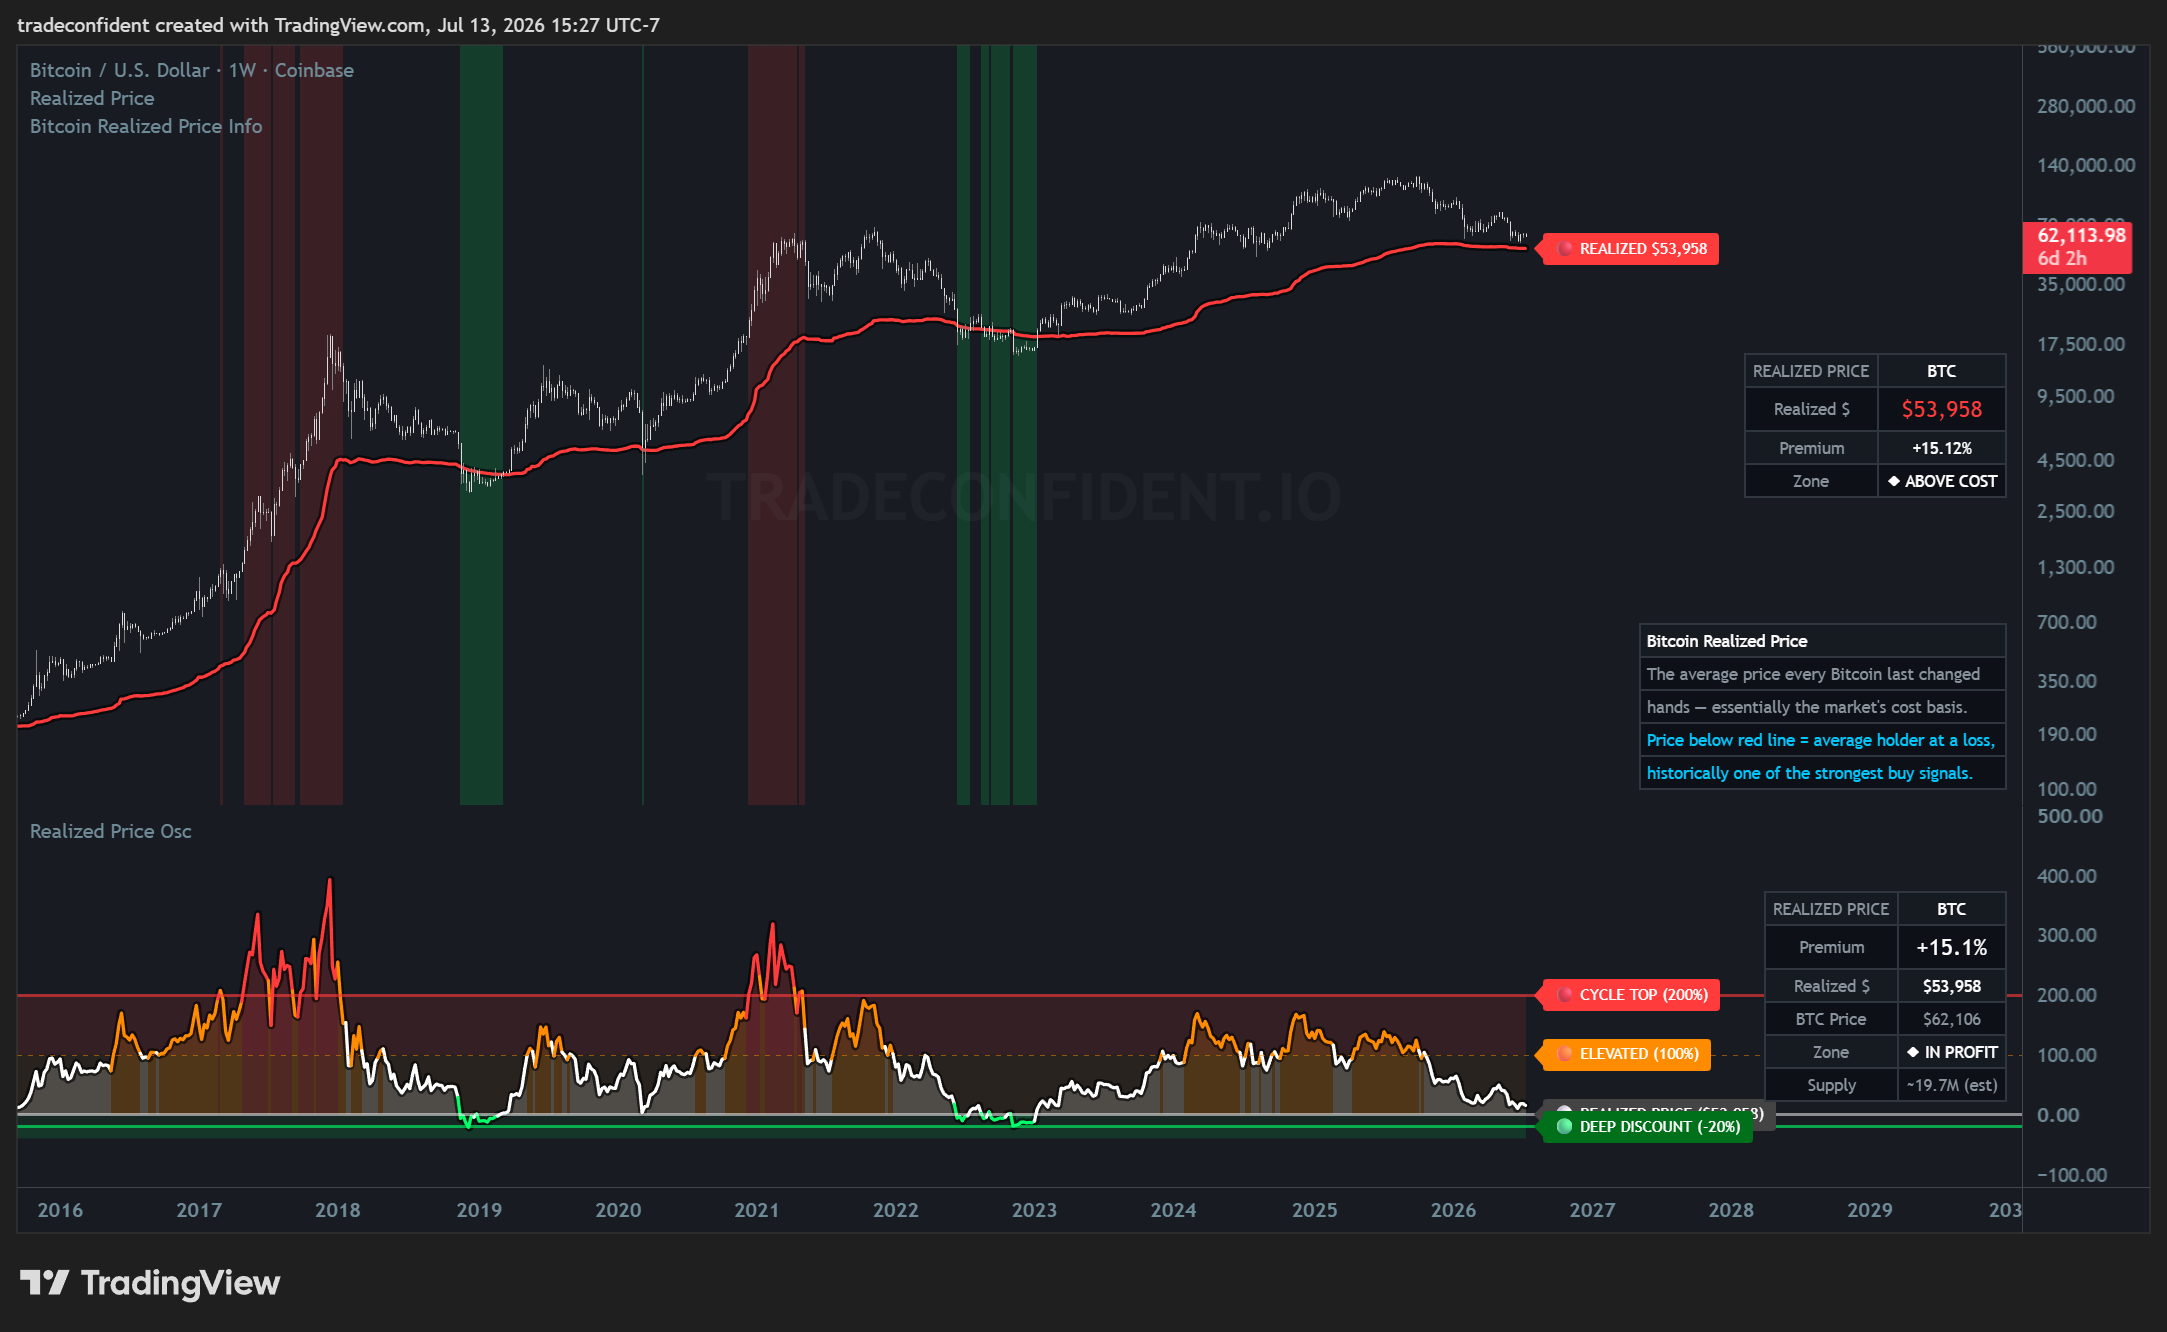
Bitcoin's trading at $62K versus a realized price of $53,958 — the market's average cost basis — leaving the average holder still up about 15.1%. Price is compressing toward that red line from above.
A tag of realized price has historically been one of the strongest buy signals, marking the 2018, 2020, and 2022 lows. That makes the $54K area the key downside level to watch for aggressive accumulation, not financial advice.
Bitcoin — Power Law, Weekly
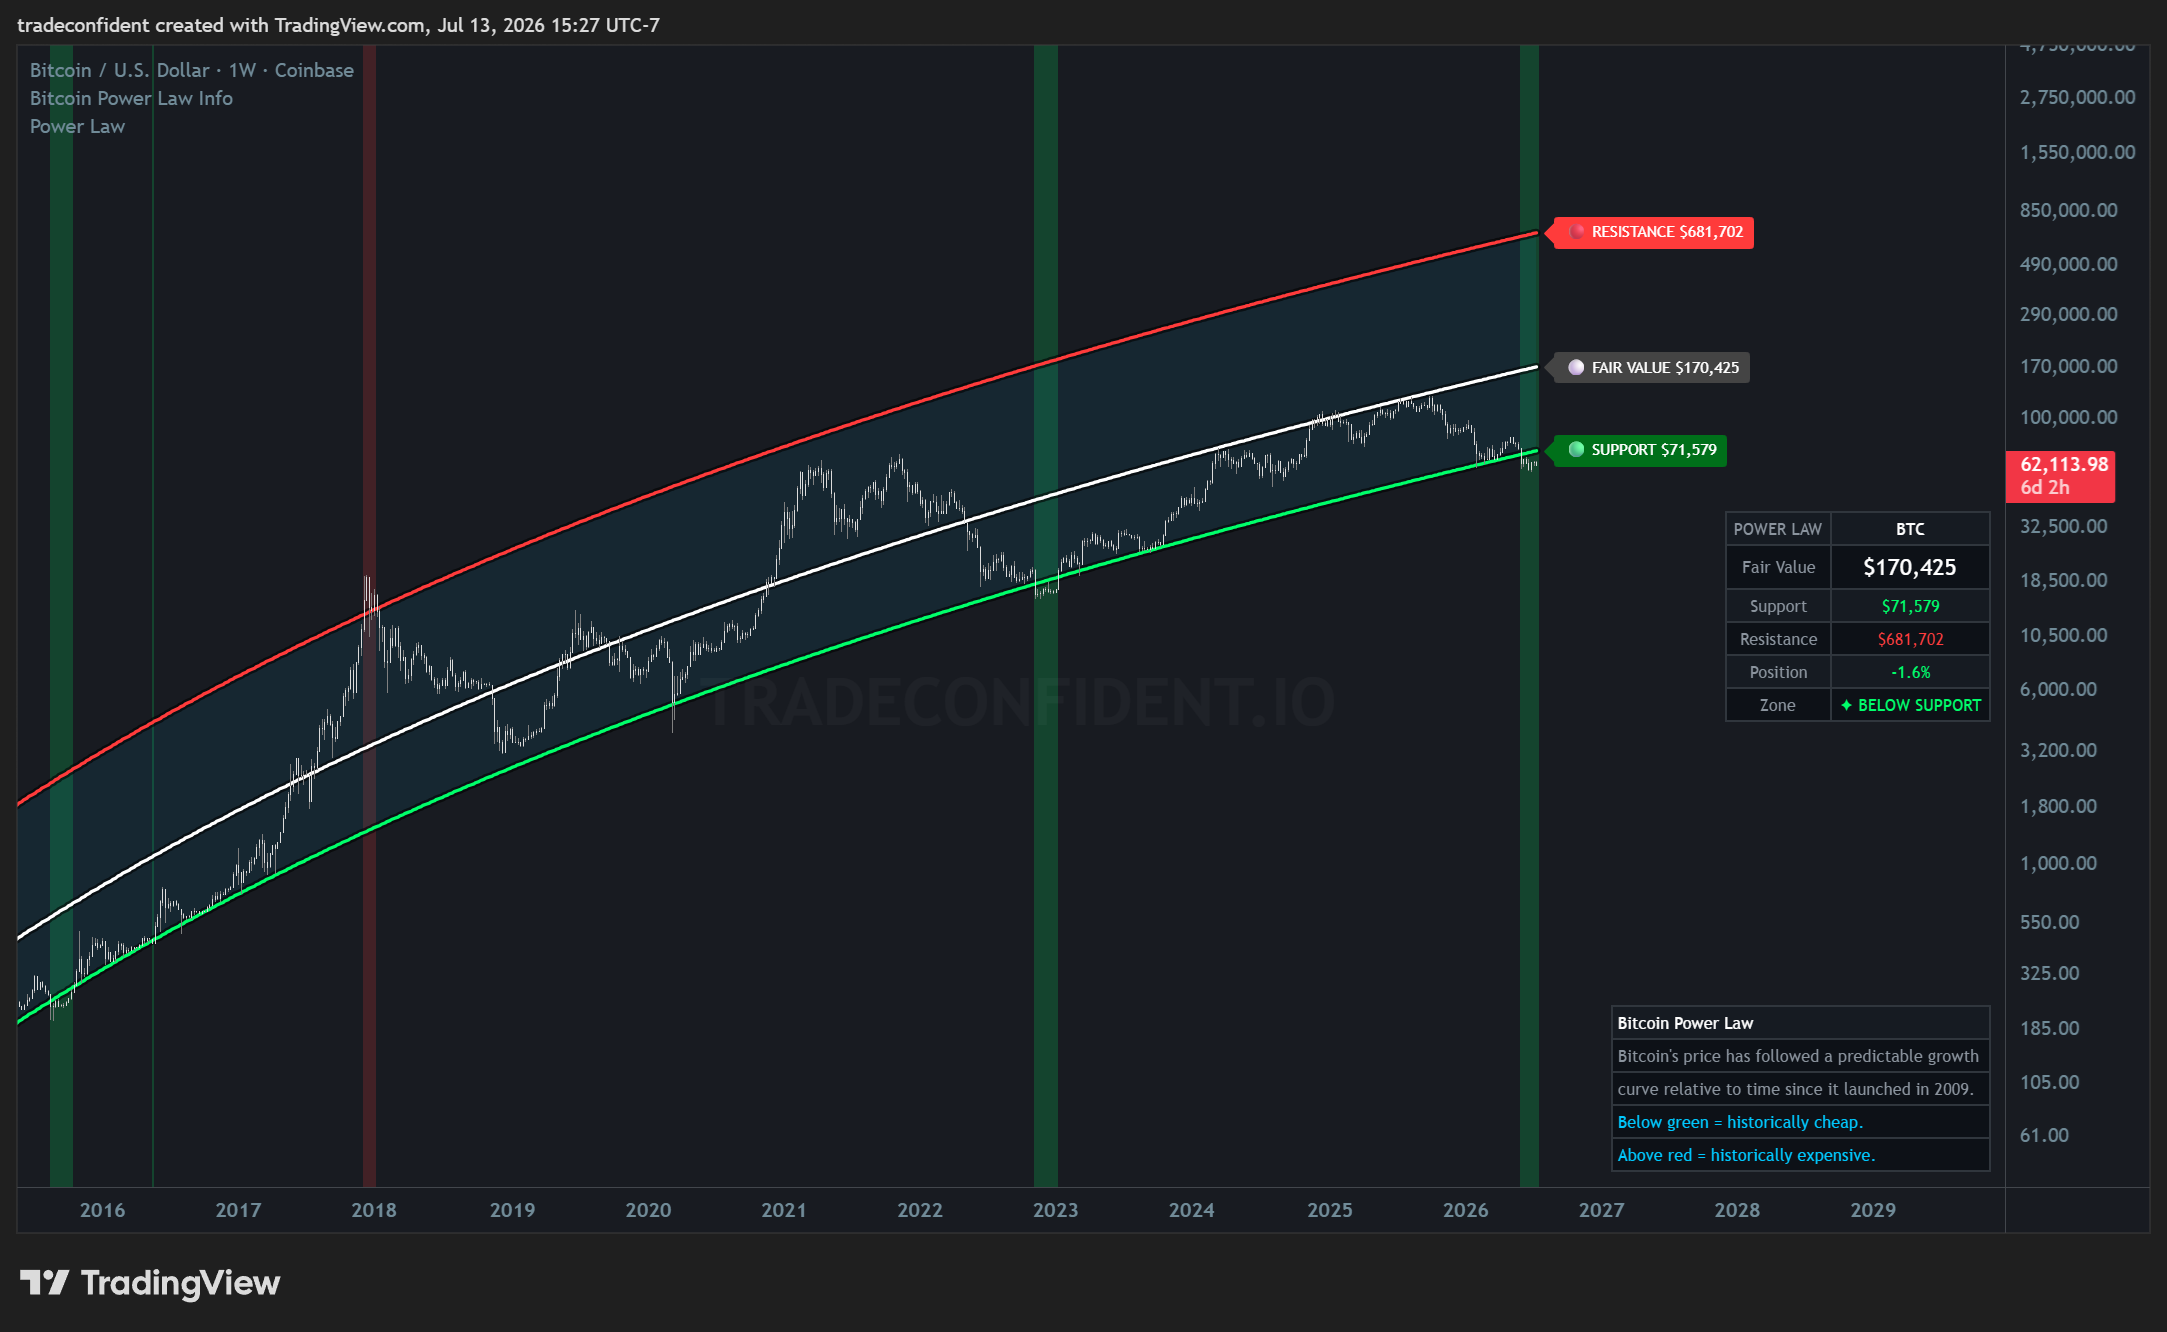
Bitcoin's at $62K, about 1.6% below the power law support curve at $71,579 — the "historically cheap" zone of a growth channel it's respected since 2009. Fair value on this model sits far above at $170K.
Time spent below the green line has been rare and brief in past cycles, marking the deepest value windows. Historically a zone for steady dollar-cost averaging, not financial advice.
Bitcoin — Puell Multiple, Daily
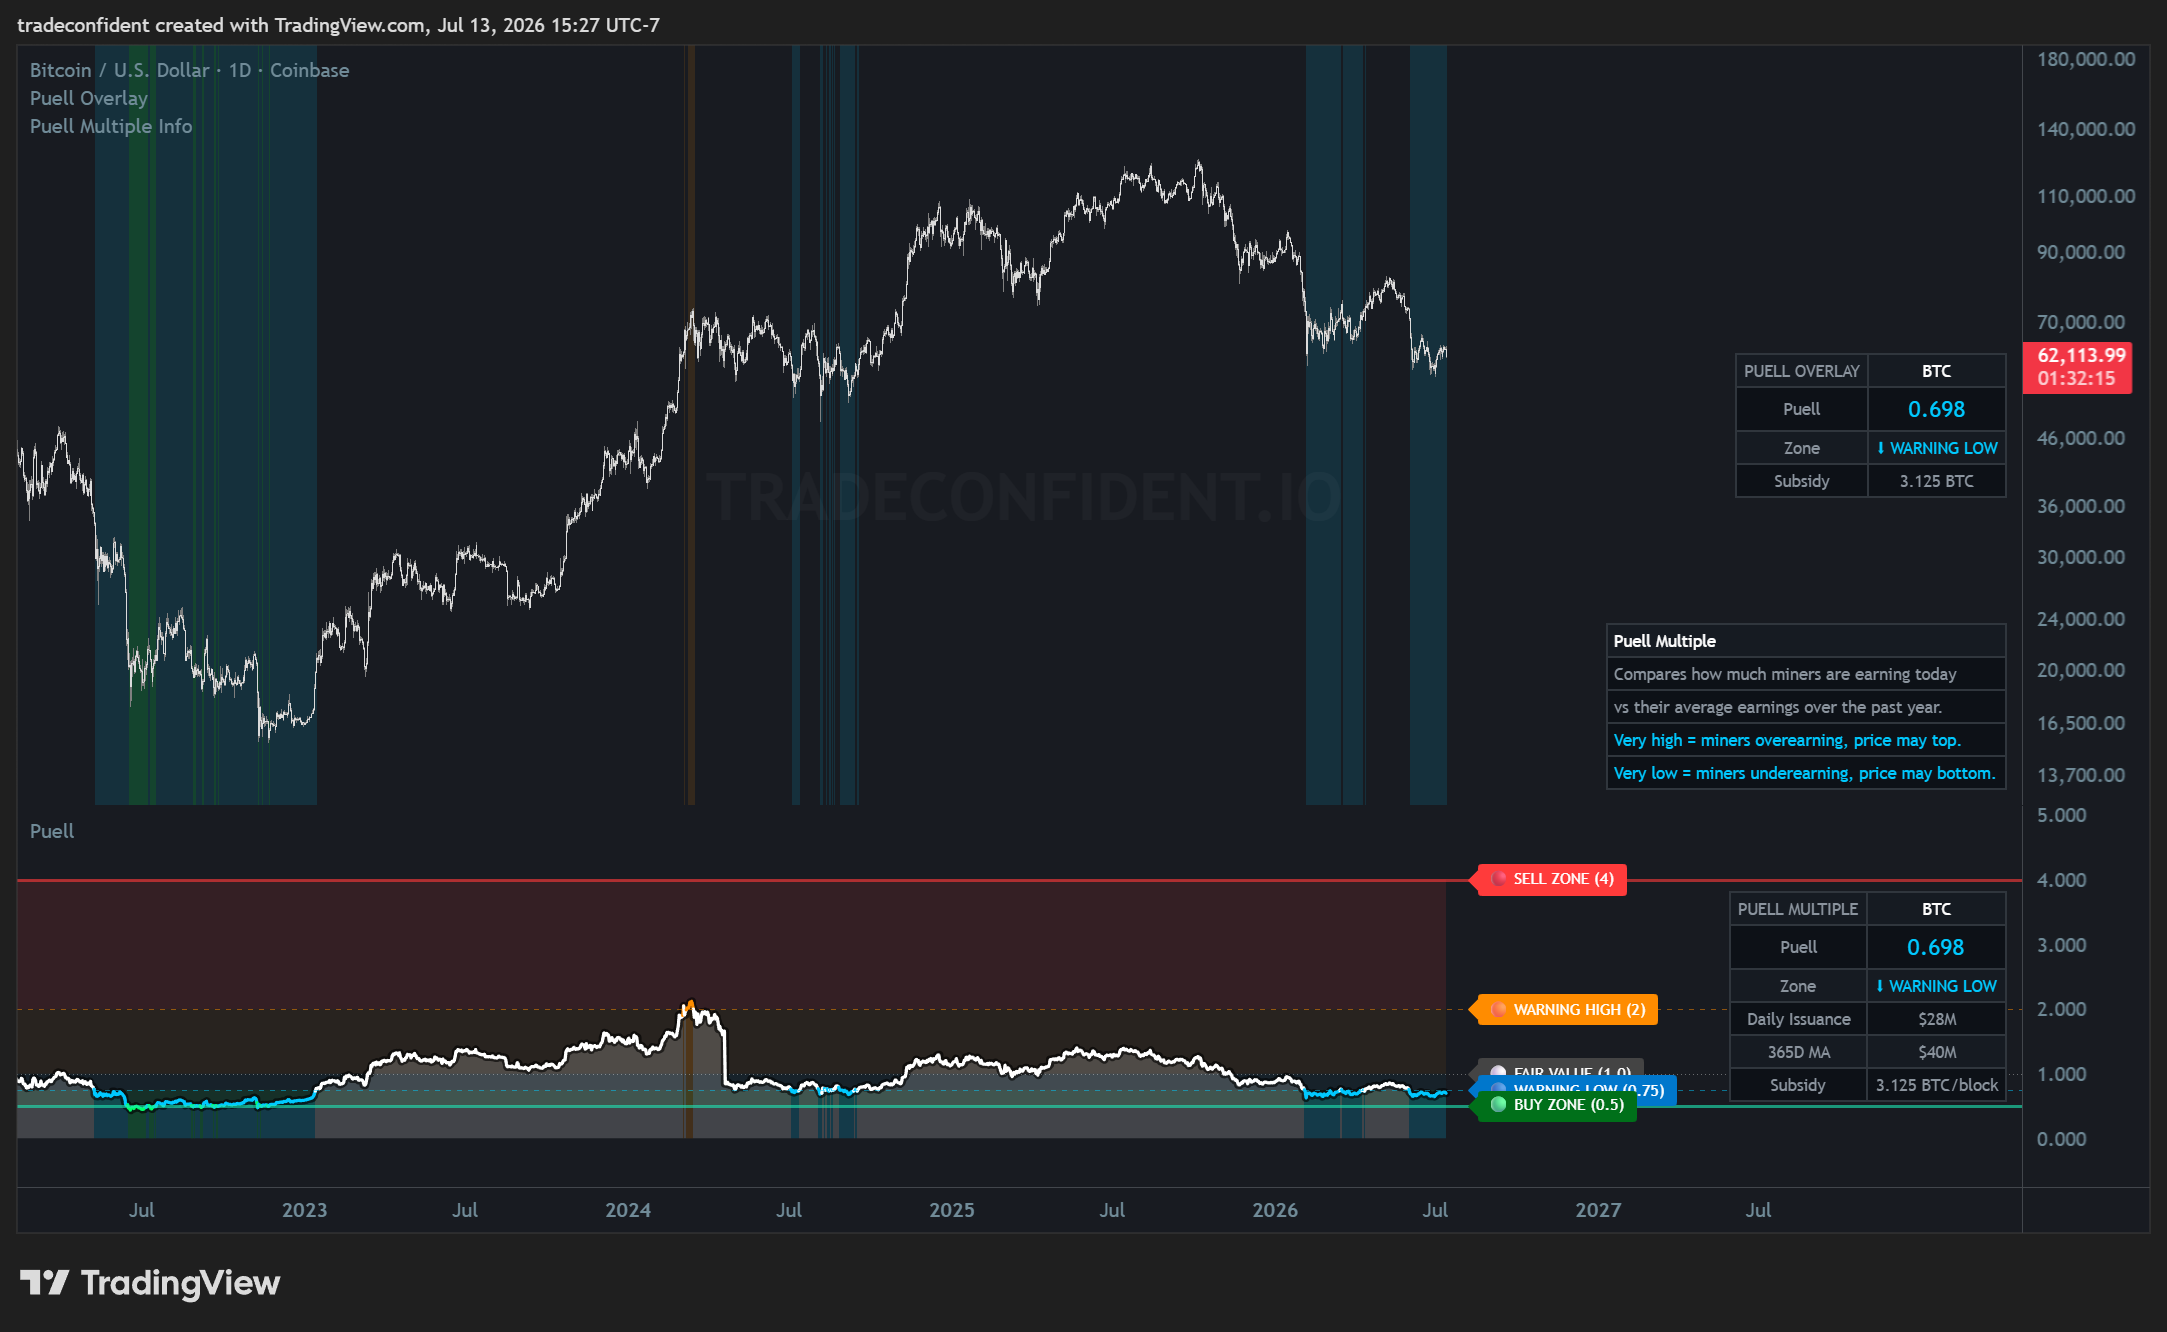
The Puell Multiple is at 0.698, in the warning-low zone — miners are earning about 30% less than their yearly average, a sign of stress in the mining economy. The formal buy zone sits just below at 0.5.
Low Puell readings have historically clustered around cycle bottoms, so this is a supportive backdrop for accumulation, with a drop below 0.5 as the stronger confirmation signal, not financial advice.
Bitcoin — MVRV Z-Score, Weekly
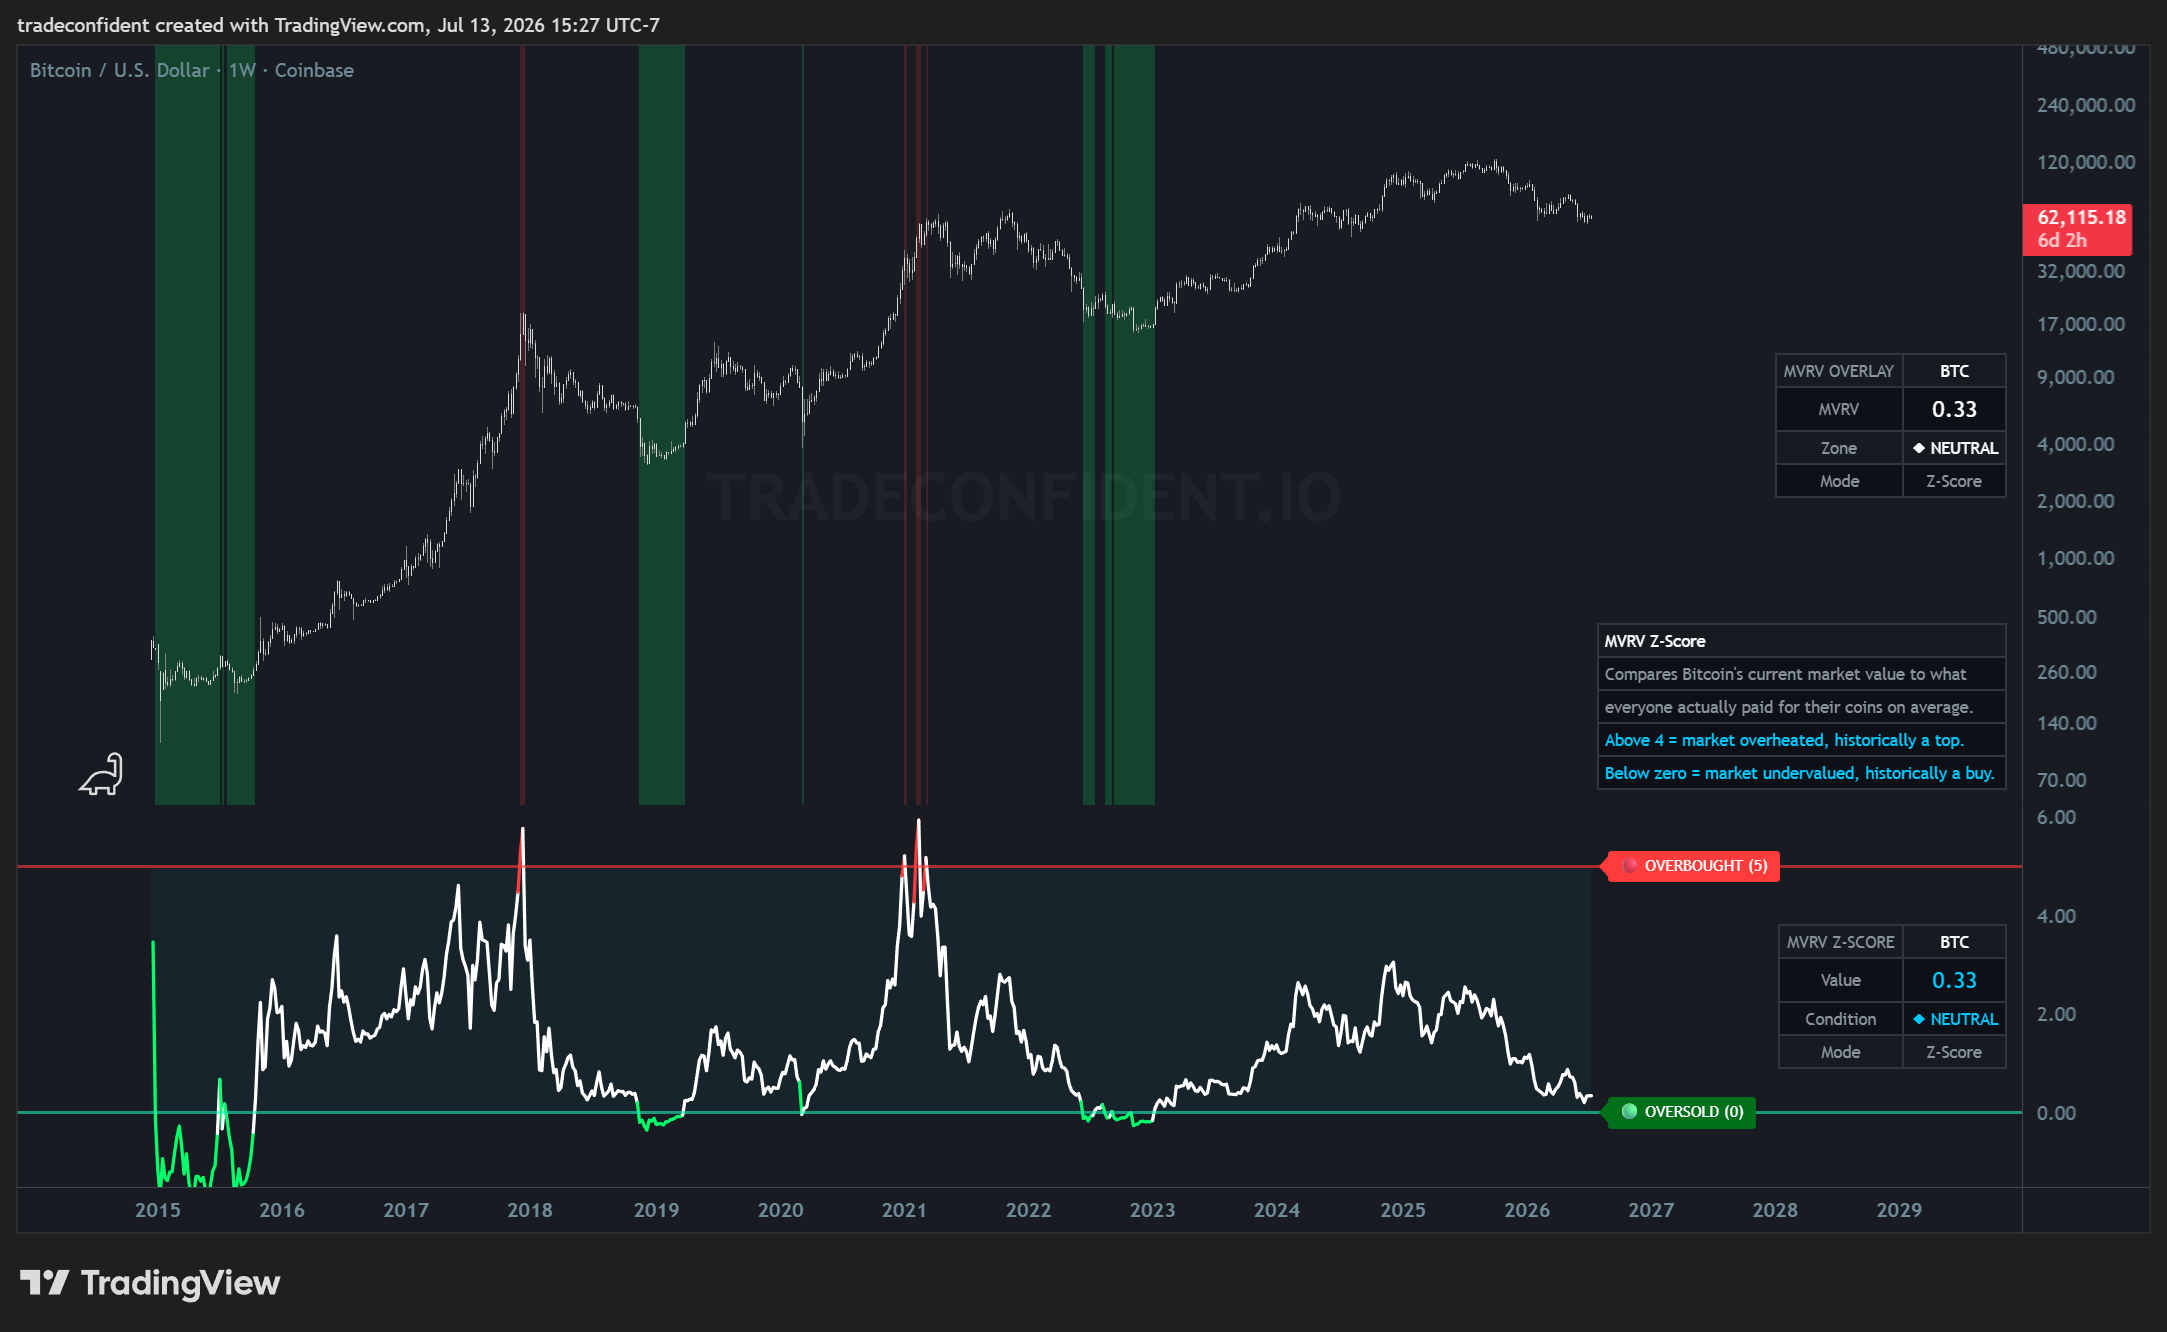
The MVRV Z-Score is down to 0.33 — neutral, but pressing right against the oversold line at zero. Every past dip below zero has marked a major cycle bottom: 2015, 2019, 2020, and 2022.
We're closer to that historic buy zone than at any point this cycle. A push below zero would be the highest-conviction accumulation signal this metric offers, not financial advice.
Market Position Summary
Taken together, these ten metrics paint a consistent picture: Bitcoin is in a historically cheap accumulation zone, but not yet at full capitulation extremes. Price is below power law support, at the miner electrical cost floor, and CVDD, Puell, and Sharpe are all at levels that have clustered near past cycle bottoms — yet MVRV hasn't broken below zero, NUPL is still neutral, and 57% of supply remains in profit.
Readings like these have historically favored being majority-allocated — roughly 60-70% in the market with 30-40% in cash held back as dry powder. That reserve is for the deeper capitulation signals that haven't fired yet: MVRV Z-Score dropping below zero, NUPL reaching its -13 capitulation band, or price tagging realized price near $54K. If those trigger, history has favored deploying the remaining cash aggressively; if price instead reclaims power law support at $71.6K, the bottoming case strengthens without them.
This is how the metrics have historically lined up, not a directive — everyone's risk tolerance and situation differ, so this isn't financial advice.

